PART I: SPECIFICATIONS
11
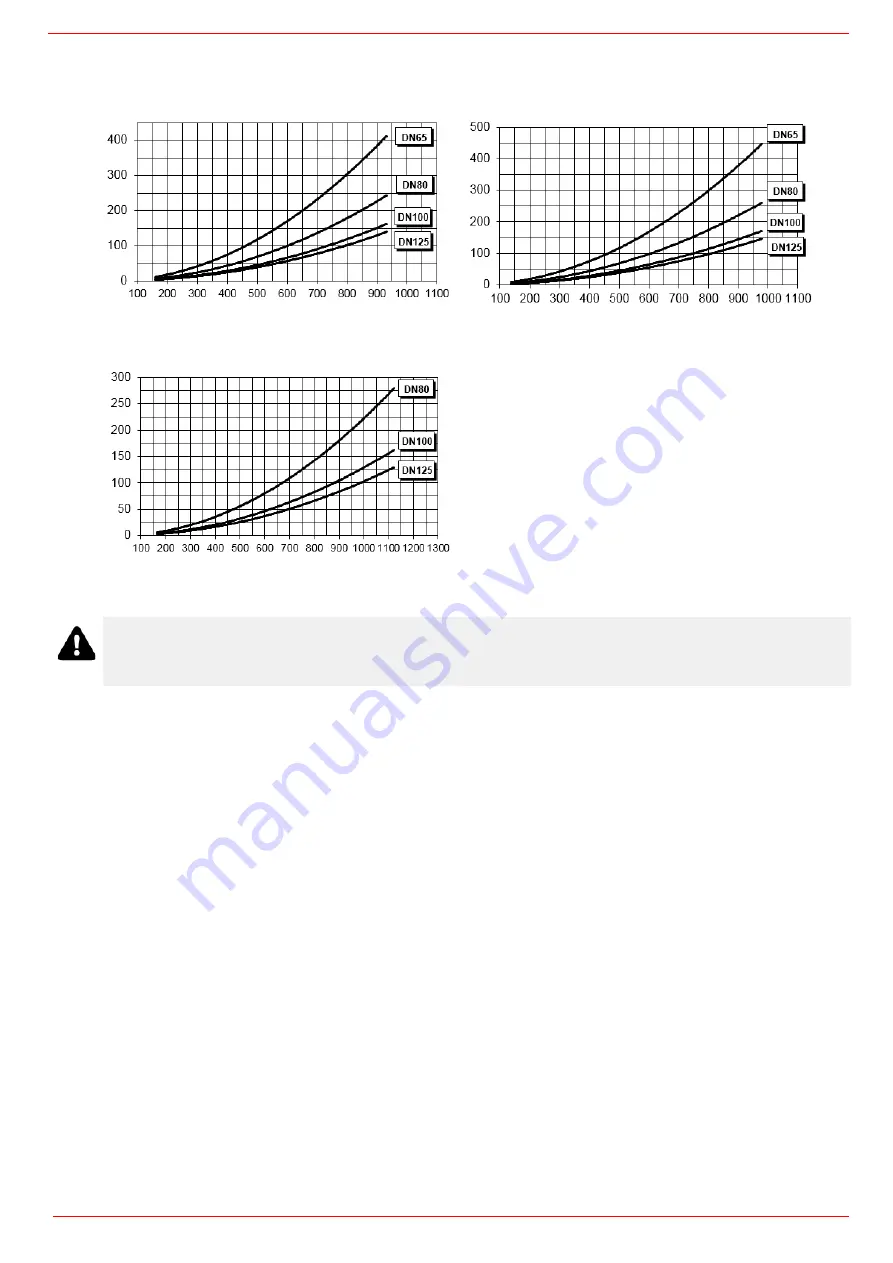
gas flow rate curves
To get the input in kcal/h, multiply value in kW by 860.
Data are referred to standard conditions: atmospheric pressure at 1013mbar, ambient temperature at 15° C
NOTE:
The performance curve is a diagram that represents the burner performance in the type approval phase or in the laboratory tests, but does not
represent the regulation range of the machine. On this diagram the maximum output point is usually reached by adjsuting the combustion head to its
“MAX” position (see paragraph “Adjusting the combustion head”); the minimum output point is reached setting the combustion head to its “MIN” position.
During the first ignition, the combustion head is set in order to find a compromise between the burner output and the generator specifications, that is why
the minimum output may be different from the Performance curve minimum
GAS PRESS
URE
IN
THE NETW
ORK mbar
RX1025.1 M-
Gas rate Stm
3
/h
RX1030R M-
Gas rate Stm
3
/h
GAS PRESSURE
IN
THE NE
TW
ORK
m
b
ar
RX1030.1 M-
Gas rate Stm
3
/h
ATTENTION: the gas rate value is quoted on the x-axis, the related network pressure is quoted on the y-axis
(pressure value in the combustion chamber is not included). To know the minimum pressure at the gas train inlet,
necessary to get the requested gas rate, add the pressure value in the combustion chamber to the value read on
the y-axis.
Summary of Contents for RX1025.1
Page 41: ......
Page 42: ......
Page 43: ......
Page 45: ...User manual Siemens LMV 5x M12914CA Rev 0 03 2008...
Page 46: ......
Page 57: ......
Page 58: ......
Page 59: ......
Page 62: ...Annex1 Example for motor cable...
Page 63: ......
Page 64: ...Annex 2 Example for sensor cable...
Page 65: ......
Page 66: ......
Page 70: ......


