38 l Uponor Smatrix Wave PLUS U@home R-167 – Smartphone/tablet apps
Trends and utilization factor
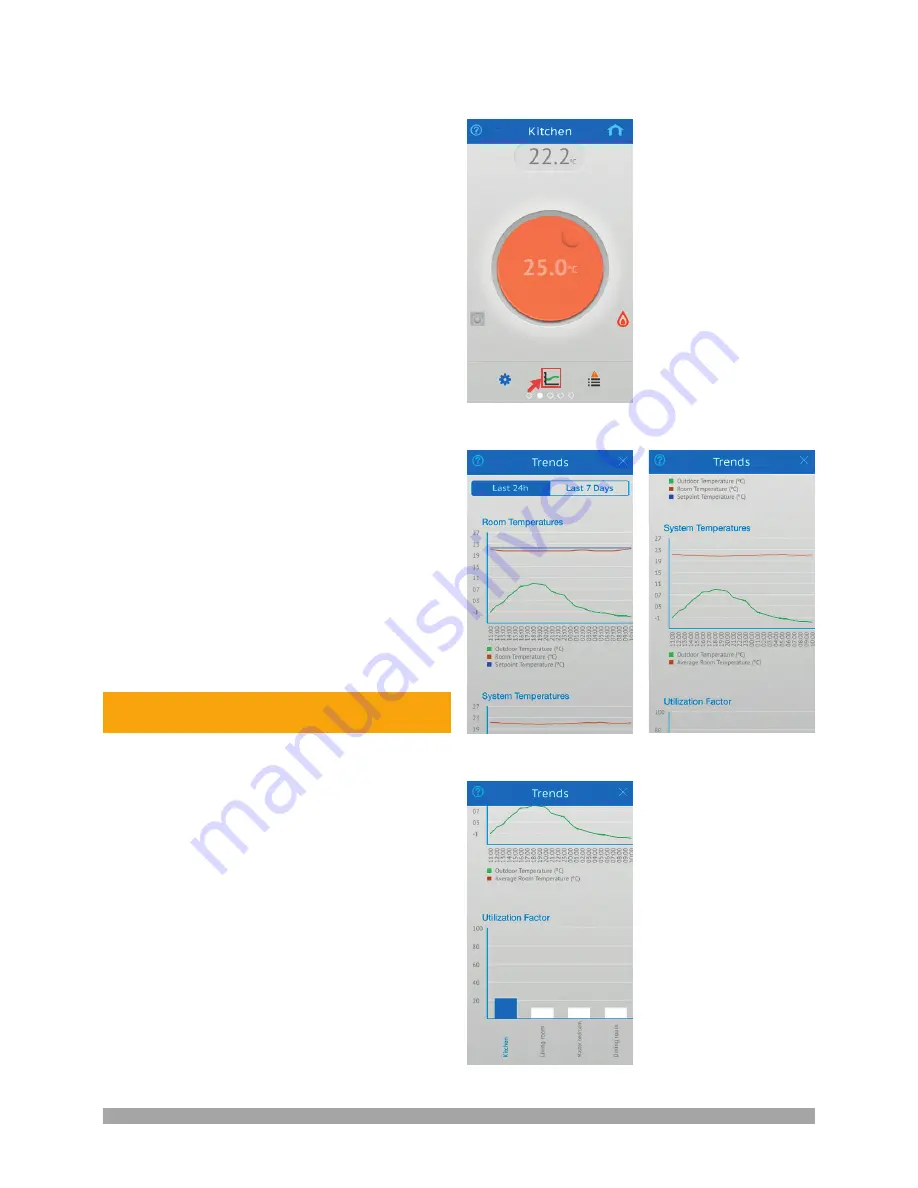
U@home can save and show the temperature values of the
system during the last 24 hours and 7 days, as well as other
information related to system performance:
• Temperature for each room.
•
Setpoint for each room.
•
Average temperature in the system.
•
Outdoor temperature, if there is an outdoor sensor
installed.
•
Utilization factor, which provides an overview of system
energy efficiency.
This information can be viewed by clicking on the statistics
(trends) icon on each room screen.
Next, a new page will be shown with two graphs:
• The first graph details the various temperatures in a par-
ticular room, comparing room temperature, setpoint and
outdoor temperature when available.
• The second graph represents system temperatures, i.e.
average temperature in the house and outdoor tempera-
ture when available.
• You can switch between the 24 hours and 7 days view by
pressing the buttons on the top part.
By scrolling down this page, the utilization factor of all rooms
can be viewed. The current room is highlighted in blue. This
indicates the percentage of time that heating or cooling is on
(actuator open). High percentages normally indicate lower
energy efficiency.
Double tap on each graph to zoom in.


