NuvaWave Handheld Disinfection Device Instructions for Use
037-0110 (Rev C)
© 2020 UV Innovators, LLC
Page 30 of 35
Section 4: Effectiveness of UVC Radiation on
Pathogens
4.1
H
OW TO
R
EAD THE
T
ABLES
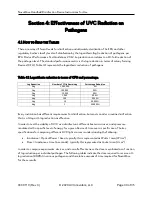
There are many different levels for disinfection and ultimately sterilization. The EPA and other
regulatory bodies classify levels of disinfection by the logarithmic (log) reduction of pathogens, per
EPA Product Performance Test Guidelines, 2012. Log reduction correlates to a 10-fold reduction of
the pathogen level. The standard performance metric is the log reduction in terms of colony forming
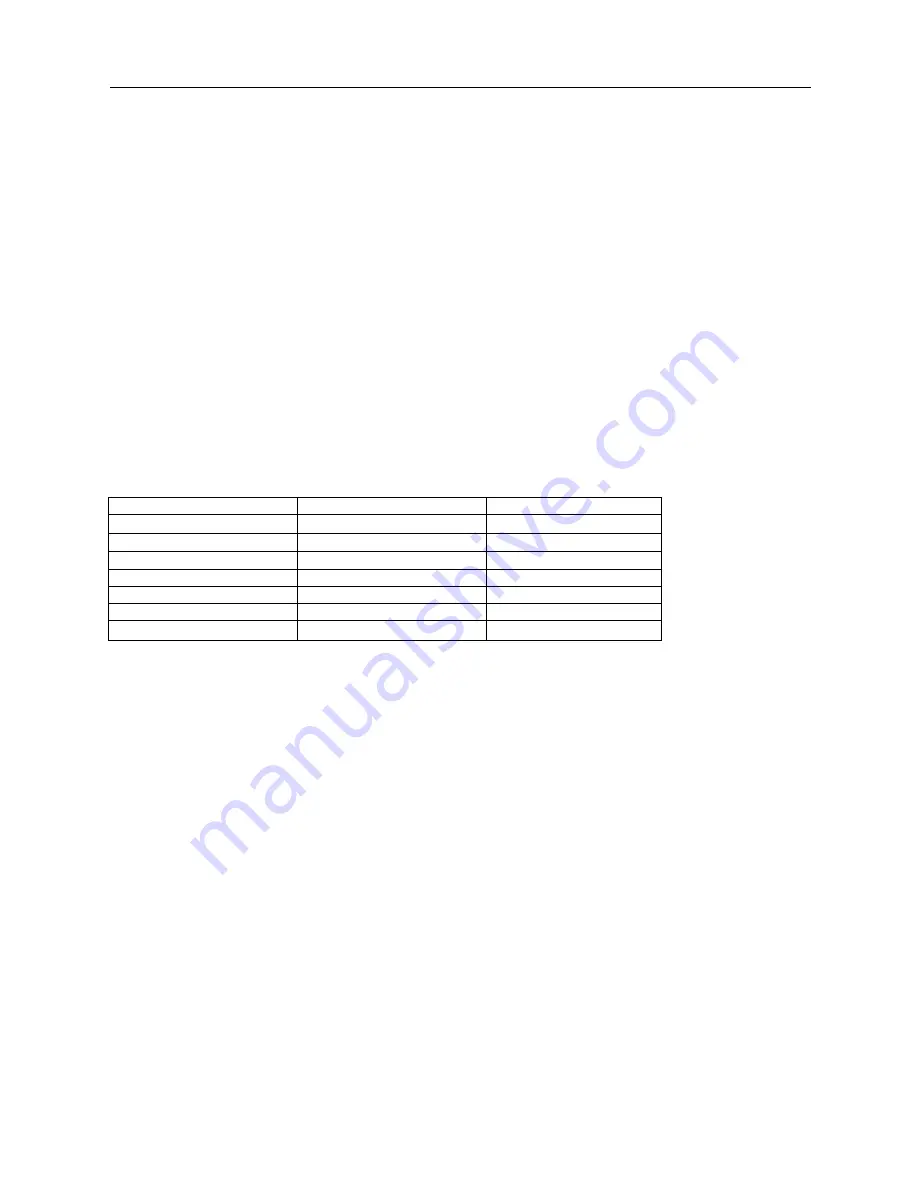
Devices (CFU). Table 4.1 represents the logarithmic reduction of pathogens.
Table 4.1 Logarithmic reduction in terms of CFU and percentage.
Log Reduction
Number of CFUs Remaining
Percentage Reduction
0log
1,000,000
0%
1log
100,000
90%
2log
10,000
99%
3log
1,000
99.9%
4log
100
99.99%
5log
10
99.999%
6log
1
99.9999%
Every institution has different requirements for disinfection, but most consider a routine disinfection
that is a 3-log or 4-log reduction as effective.
In order to test the viability of UVC as a disinfectant, different bacteria, viruses, and spores are
irradiated with a specific level of energy for a given Device of time over a specific area. The key
specifications for comparing different UVC light sources is understanding the following:
•
Irradiance = Optical Power / Area; typically this is represented as Watts / area (W/cm
2
)
•
Dose = Irradiance x time (in seconds); typically this represented as Joule / area (J/cm
2
)
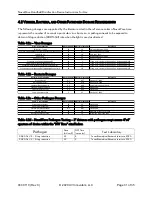
In order to compare experiments, devices, and overall effectiveness, the dose is evaluated as a function
of log reduction per individual pathogen. The following tables indicate the dose required to receive a 3-
log reduction (99.9%) in various pathogens and the relative amount of time required for NuvaWave
for these results.


