Chapter 4 ________________________________________________________________ Operation
VAISALA _______________________________________________________________________ 53
0705-208
Figure 29
Main Menu (main level)
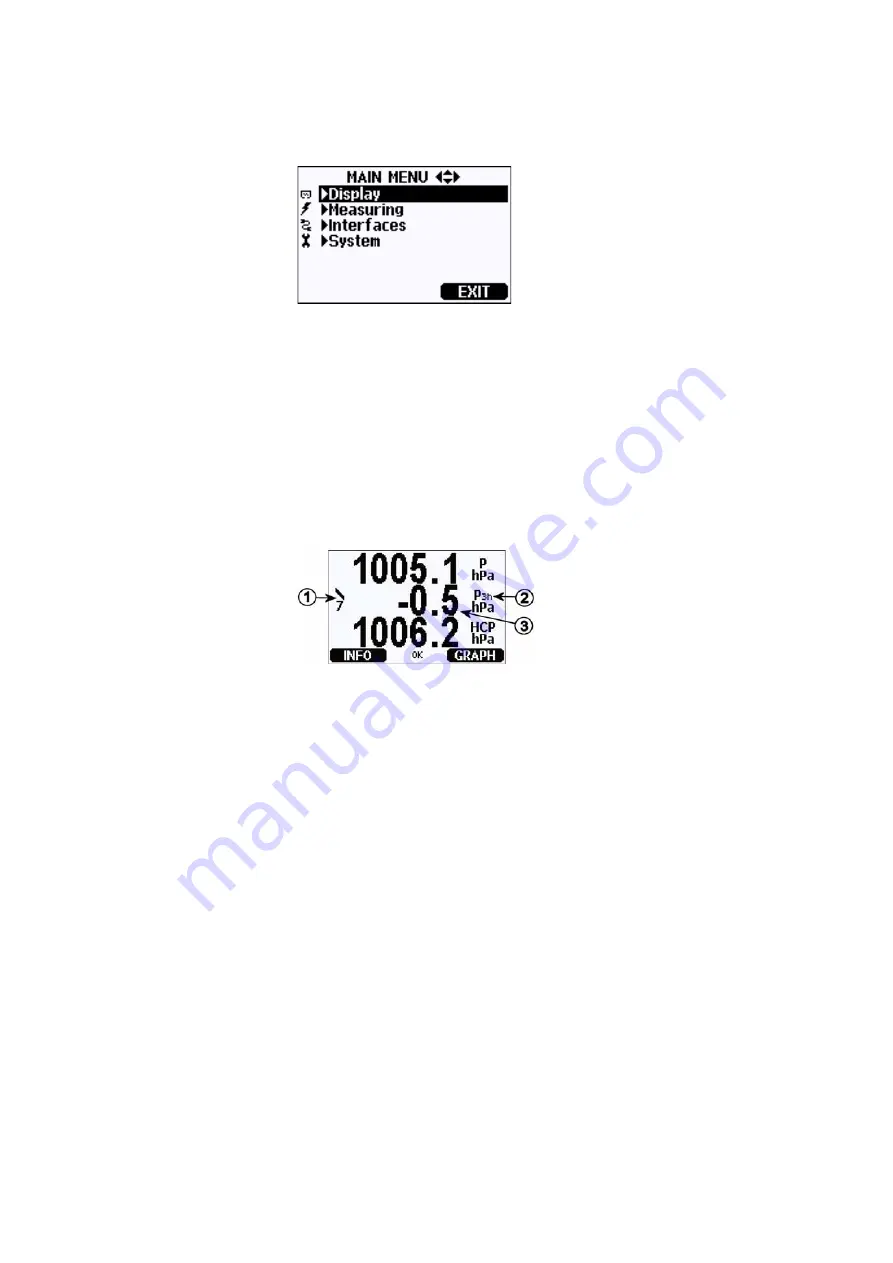
Pressure 3h Trend and Tendency
Reading
Using Basic Display
0705-182
Figure 30
P
3H
Tendency
Pressure tendency graphics and codes
The characteristic symbols of pressure tendency during the 3 hours
preceding the time of observation are described as follows:
Numbers refer to
1
=
Tendency: Increasing/decreasing graph symbol with the code
number (for more information, see
Tendency Description, on page 54
2
=
P3h symbol
3
=
Trend (middlemost numeric value in the example),
that is, pressure change during last 3 hours


