Shear lines are characterized by both vorticity and convergence (negative divergence). The
vorticity associated with cold fronts in the Northern hemisphere is typically positive. The
vorticity associated with thunderstorm gust fronts is usually, but not always, positive. Shear
lines are not characterized by positive divergence, as are microbursts.
Both azimuthal shear (partial vorticity) and radial shear (partial divergence) typically show a
signature for a shear line.
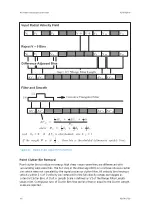
5.7.2 Shear Line Algorithm
The Shear Line (
SLINE
) algorithm uses the uniform wind assumption.
1. The radial, azimuthal, or combined shear are computed using the
SHEAR
algorithm.
The previous
VVP
wind is used to remove the apparent azimuth shear caused by the
mean wind.
The shears are computed using polar data and the output is then X-Y data to a
selectable grid spacing.
2. The shear magnitude is thresholded with regard to strength and area within a specified
area.
Shear regions less than the threshold or smaller than the area limit are not considered.
3. The shear magnitude values of 2 elevations are ANDed.
This step is optional if a second elevation is specified.
4. A curve is fitted to the shear field to detect a linear region.
Points that fall outside the curve are eliminated, and the curve is refit.
Only one shear line can be considered in a product.
5. The speed of motion normal to the gust front is obtained by comparing the data from
the current shear line location with the data from the previous location.
6. The
VVP
wind is computed in both areas defined by the shear line using the uniform
wind assumption.
7. The computed motion is projected to determine if and when the shear line will cross
each protected area.
8. The results are output.
5.8
SWS
: Surface Weather Stations
IRIS can store and display METAR and SYNOP reports from Surface Weather Stations. These
are stored in the
SWS
product.
A single product file contains reports from many (or all) stations in the radar coverage area.
Since this data is not generated from the radar data, there is no product configuration menu
to create such products. Instead the product file is created when METAR or SYNOP text
messages from a surface weather station are passed through an IRIS pipe program.
This data is displayed as a series of "station plots", which show various stored data, such as
the temperature, wind direction, pressure, and similar. These can be plotted stand-alone, or
on top of radar products. You can also click the cursor to see the raw station reports.
IRIS Product and Display User Guide
M211319EN-H
192
RESTRICTED
Summary of Contents for IRIS
Page 1: ...M211319EN H RESTRICTED User Guide IRIS Radar IRIS Product and Display...
Page 12: ...IRIS Product and Display User Guide M211319EN H 10 RESTRICTED...
Page 71: ...Chapter 3 Configuring IRIS Products RESTRICTED 69...
Page 303: ...Figure 103 Typical Spectrum Plot Appendix A Basic Radar Meteorology RESTRICTED 301...
Page 386: ......
Page 392: ......
Page 393: ......
Page 394: ...www vaisala com...


