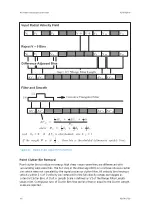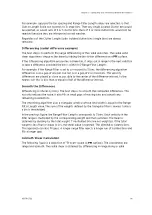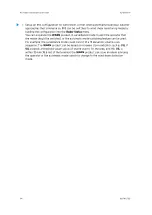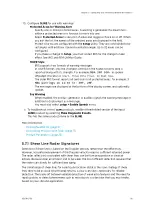
The plot details are as follows.
#1 Cloud Coverage
A pie chart showing coverage in oktas (that is, eights) of sky coverage drawn using standard
symbols. The example shows 6 oktas.
Because METAR messages do not give cloud cover in oktas units, METAR text is mapped as
follows:
METAR message
Oktas
SKC
or
CLR
0 oktas
FEW
1 okta
SCT
3 oktas
BKN
6 oktas
OVC
8 oktas
Figure 70 Okta Standard Symbols
#2 Wind Barb
A line with feathers showing the wind speed and direction, to the nearest 5 knots.
A knot (nautical mile per hour) is close to half a meter/second, so 20 knots would be 10 m/s.
The line points up wind. It has a half feather line for 5 knots, and full length lines for 10 knots,
and a triangular flag for 50 knots. If the wind speed is 0, then a circle is draw outside the sky
coverage circle.
The example shows a wind of 5 knots from the south.
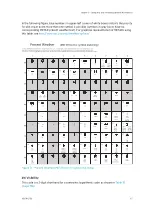
#3 Present Weather
There is a large set of available symbols, shown in the following figure. The example in
shows 2 dots, which means light rain.
Matching of METAR present weather text to symbols in
is not
necessarily endorsed by the National Weather Service (NWS) or the World Meteorological
Organization (WMO).
IRIS Product and Display User Guide
M211319EN-H
194
RESTRICTED
Summary of Contents for IRIS
Page 1: ...M211319EN H RESTRICTED User Guide IRIS Radar IRIS Product and Display...
Page 12: ...IRIS Product and Display User Guide M211319EN H 10 RESTRICTED...
Page 71: ...Chapter 3 Configuring IRIS Products RESTRICTED 69...
Page 303: ...Figure 103 Typical Spectrum Plot Appendix A Basic Radar Meteorology RESTRICTED 301...
Page 386: ......
Page 392: ......
Page 393: ......
Page 394: ...www vaisala com...

