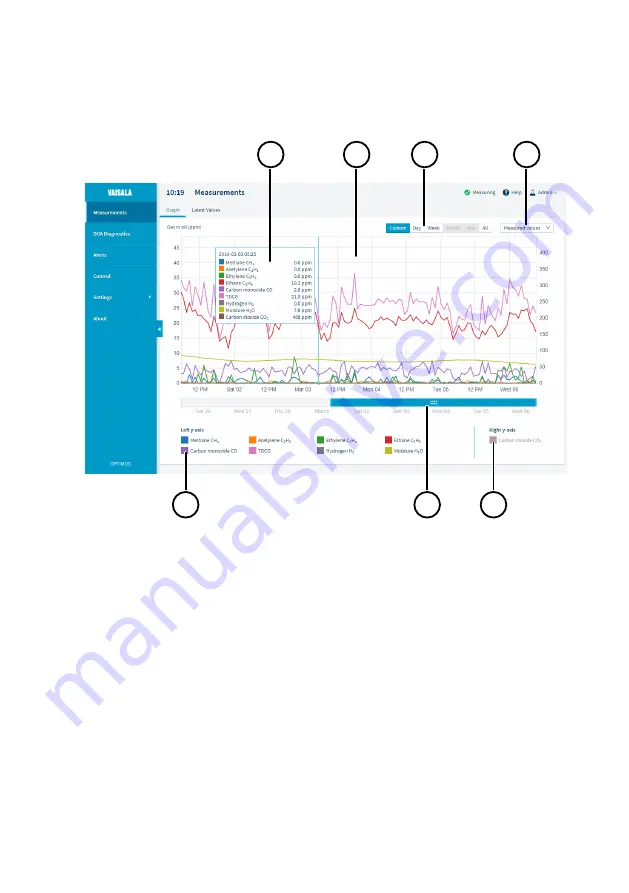
3.1.2 Measurements Page
Measurements
page provides the measurement data in graph and table format.
1
2
3
4
5
7
6
Figure 10 Measurement Graph
1
Pop-up that shows the values at the point below the cursor.
2
Graph area. Use the mouse wheel to adjust the zoom level of the y-axis.
3
Quick selection buttons for preset time windows.
4
Drop-down menu for selecting the parameter set that is shown.
5
Parameters that are shown on the left y-axis. To show and hide parameters, select their
color tab.
6
Time slider for selecting the time window shown in the graph area. To adjust the size of
the time window, drag the edges of the slider. To move the time window, drag the slider.
7
Measurement parameters on the right y-axis. Drag individual parameters to this area to
show them on the right y-axis. This is useful when one of the parameters has a different
range of values than the rest.
Chapter 3 – User Interface
21
Summary of Contents for Optimus OPT100
Page 1: ...M211858EN E User Guide Vaisala Optimus DGA Monitor for Transformers OPT100...
Page 24: ...Figure 11 Measurement Graph for 1 Day Rate of Change Values OPT100 User Guide M211858EN E 22...
Page 72: ...OPT100 User Guide M211858EN E 70...
Page 76: ...OPT100 User Guide M211858EN E 74...
Page 77: ......
Page 78: ...www vaisala com...


