•
Create
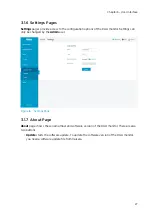
generates a diagnostic data file from the DGA monitor. If a data file already exists,
it is overwritten by the new file. Generating the file may take up to 30 minutes.
Select
Download Data
to retrieve the file. The diagnostic data in the file is intended for
use only by Vaisala.
Figure 17 About Page
3.1.8 Messages
User interface of the DGA monitor will display important information as messages at the top of
the user interface.
•
Gas level alerts
: Shown until acknowledged, until the gas level is no longer above the
limit, or until the alert is disabled. Flashing yellow or red status LED on the DGA monitor
door means that one or more gas level alert (and the corresponding message) is active.
•
Errors
: Software or device errors. For example, accidentally closing the oil valves on the
transformer while the DGA monitor is measuring will cause a device error as it cannot
circulate oil. If the red LED on the DGA monitor door is lit but not flashing, a device error is
active and requires user actions.
•
Other notifications
: Any other messages from the DGA monitor. For example, a message
will be shown when a new measurement cycle has been completed.
OPT100 User Guide
M211858EN-E
28
Summary of Contents for Optimus OPT100
Page 1: ...M211858EN E User Guide Vaisala Optimus DGA Monitor for Transformers OPT100...
Page 24: ...Figure 11 Measurement Graph for 1 Day Rate of Change Values OPT100 User Guide M211858EN E 22...
Page 72: ...OPT100 User Guide M211858EN E 70...
Page 76: ...OPT100 User Guide M211858EN E 74...
Page 77: ......
Page 78: ...www vaisala com...


