Manual for VAKI Micro/Macro
Page 17
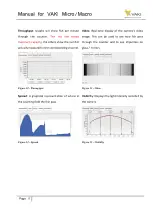
Throughput
: Graphs will show fish per minute
through the counter.
The red line shows
maximum capacity
, the others show the number
actually measured in the corresponding channel.
Figure 12 - Throughput
Video
: Real-time display of the camera's video
image. This can be used to see how fish pass
through the counter and to see impurities on
glass / mirrors.
Figure 13 - Video
Spread
: A graphical representation of where in
the counting field the fish pass.
Figure 14 - Spread
Visibility
: Displays the light intensity recorded by
the camera.
Figure 15 - Visibility


