Section 8 | Data Display in TideMaster Express
Page | 41
©
2021
– Valeport Ltd
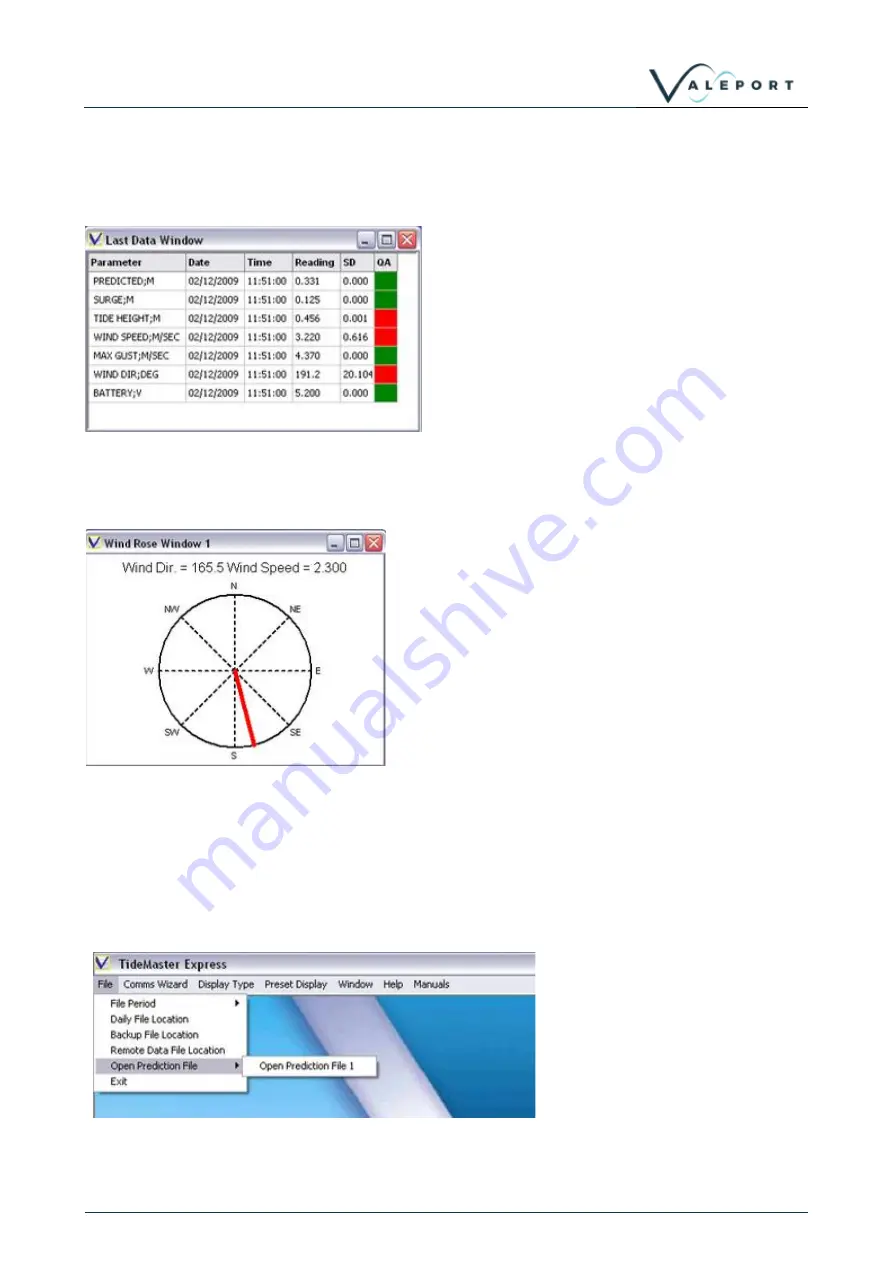
8.3.5 Last Data Display
This data display mode allows the most recent reading
from multiple sensors to be displayed in a tabular
format.
Right-click the display to show an Options menu.
Simply choose the required sensors Note that
repeating this process will add further sensors to the
table.
8.3.6 Wind Rose Display
The wind rose display provides a convenient indication
of the direction from which the wind is currently
blowing, as well as giving a numerical indication of the
magnitude and bearing.
This display will appear when “Wind Rose Display” is
selected from the Display Type menu, and will be
updated as new data is received.
The display may be moved and sized, but there are no
other user changeable features.
8.3.7 Prediction Files
All measured tide data may be compared to predicted tide data for a designated site, provided it is available
in the standard UK Hydrographic Office “.mt04” format.
The Prediction File should be placed in a convenient location either locally or the LAN
– note that if it is on
the LAN then multiple users may access the file
Open the File by clicking File / Open
Prediction File, and navigating to the
correct location. Click Open


