3-12
SurgiStat II Service Manual
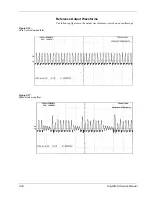
Output Power Curves
The curves that follow depict the changes for each mode at specific power
settings. All measurements were taken at the nominal input power voltage used
for calibration.
Monopolar Cut Curves
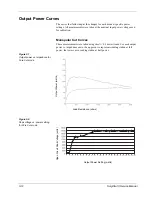
These measurements were taken using short (< 0.5 meter) leads. For each output
power vs. impedance curve, the upper curve represents readings taken at full
power; the lower curve, readings taken at half power.
Figure 3-1 .
Output power vs. impedance for
Pure Cut mode
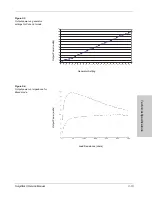
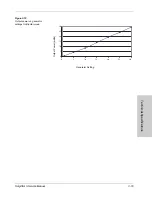
Figure 3-2.
Peak voltage vs. power setting
for Pure Cut mode
Load Resistance (ohms)
Output Power (watt
s
)
Output Power Setting (watts)
Open
C
ircuit Pe
ak V
o
lt
ag
e
(vo
lt
s
)
Summary of Contents for SurgiStat II
Page 1: ...Service Manual SurgiStat II Electrosurgical Generator ...
Page 24: ...2 12 SurgiStat II Service Manual ...
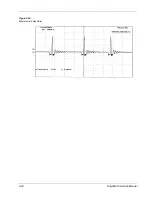
Page 46: ...3 22 SurgiStat II Service Manual Figure 3 20 Bipolar mode waveform ...
Page 60: ...5 6 SurgiStat II Service Manual ...
Page 64: ...6 4 SurgiStat II Service Manual ...
Page 74: ...7 10 SurgiStat II Service Manual ...


