84
03-914875-00:1
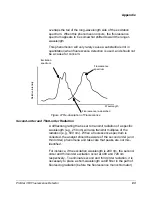
An Example of a Fluorescence Spectrum
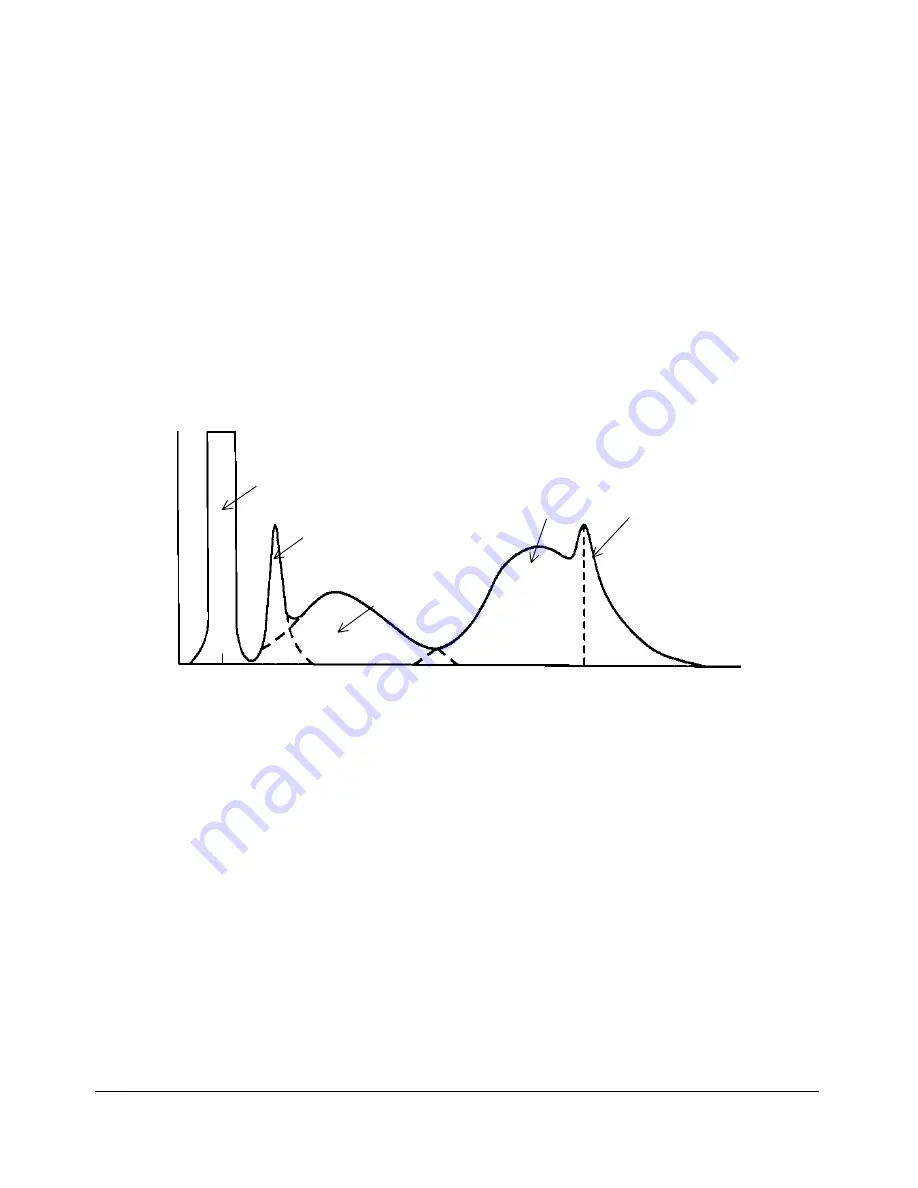
Figure 28 provides an example of a fluorescence spectrum
which contains the various types of peaks indicated above. In
most cases, the fluorescence of the compound of interest lies
closer to the excitation than shown in Figure 28, and overlapping
of peak of interest and the second order radiation is rarely a
problem. Typically, the peak for the compound of interest might
correspond to peak 3, and the analyst might have to correct for
the Raman peak (e.g. use a shorter excitation wavelength).
Figure 28 Measurement Example of Fluorescence Spectrum
Relative intensity
Wavelength
1
4
3
2
EX
×
2
EX
5
1.
Scattering of excitation beam
2.
Raman scattering due to eluent
3.
Fluorescence of compound of interest
4.
Fluorescence of impurity
5.
Second-order scattering of excitation beam
Summary of Contents for ProStar 363
Page 2: ......
Page 6: ...iv 03 914875 00 1...
Page 20: ...14 03 914875 00 1...
Page 82: ...76 03 914875 00 1...

