Personal aXsGUARD - 7.7.1
© VASCO Data Security 2013
27
Chapter 6. Status, Logging and
Diagnostics
6.1. Overview
In this chapter, we explain how to:
• Check the PAX connection status and logs (remotely and locally)
• Use the diagnostic tool for troubleshooting
• Initiate a remote support connection
6.2. Checking the Status
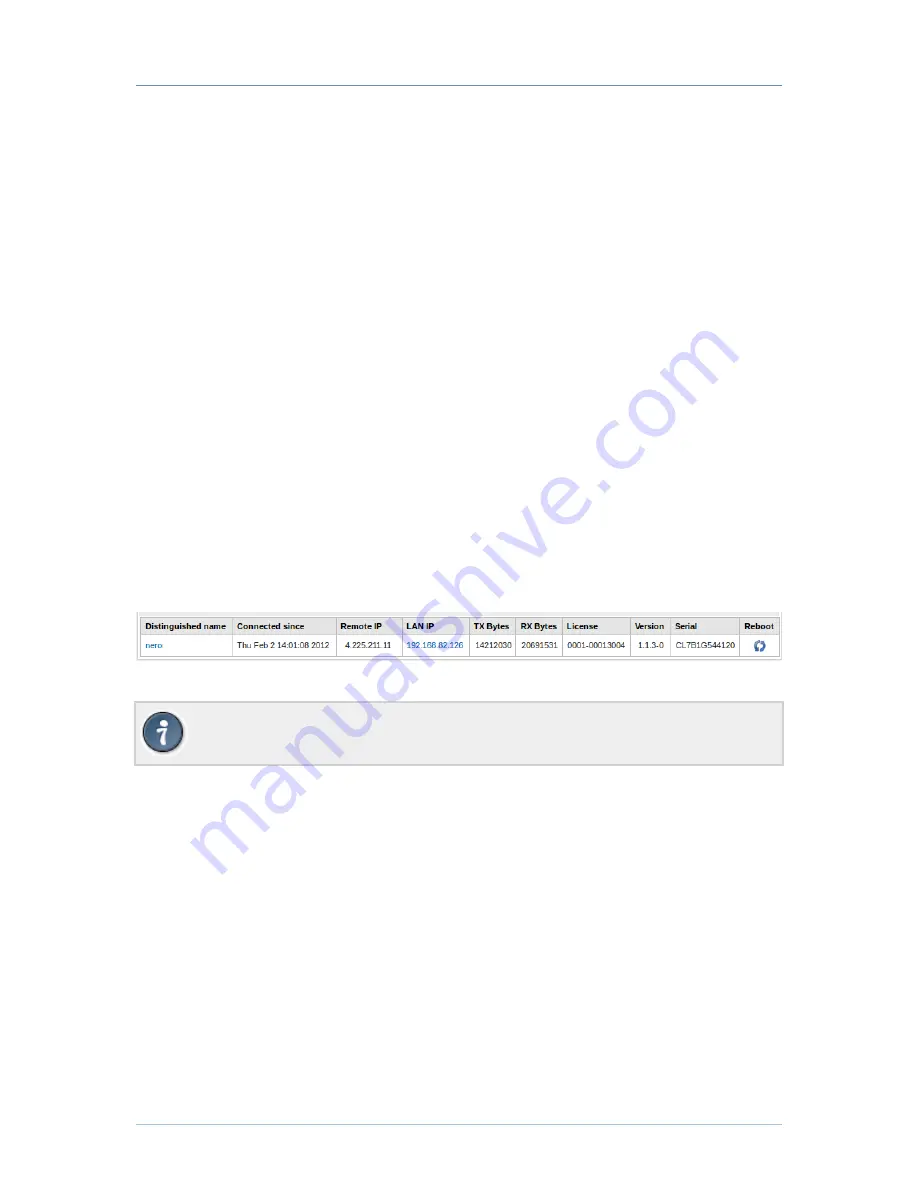
You can check the status of any deployed PAX remotely (on the aXsGUARD Gatekeeper VPN server) or locally
(on the PAX itself). The status screen provides information about the connection, the IP address, transmitted
and received bytes, license information, etc. The information is pretty self-explanatory.
6.2.1. On the aXsGUARD Gatekeeper
1. Log on to the aXsGUARD Gatekeeper, as explained in the aXsGUARD Gatekeeper System Administration
How To, which is accessible via the Documentation button in the Administrator Tool.
2. Navigate to VPN & RAS
⇒
Status
⇒
Personal aXsGUARD.
Figure 6.1. Status Information Screen
aXsGUARD Gatekeeper administrators can easily reboot any connected PAX by clicking on the reboot
button.
6.2.2. On the Personal aXsGUARD
Several status screens are available locally on the PAX. They provide status information about the DHCP
server, the WAN interface, applicable NAT rules, etc.
1. Log on to the PAX Administrator Tool, as explained in
Section 5.4, “Installation Instructions”
.
2. Click on the appropriate menu on the left to view the relevant status information, e.g. DHCP.
6.3. Checking the Logs
You can view PAX logging information on the aXsGUARD Gatekeeper as well as locally (on the PAX). There
are two types of logging on the aXsGUARD Gatekeeper; i.e. server and client logging.
6.3.1. On the aXsGUARD Gatekeeper
1. Log on to the aXsGUARD Gatekeeper, as explained in the aXsGUARD Gatekeeper System Administration
How To, which is accessible via the Documentation button in the Administrator Tool.

