3D Mapping Function
E-19
DISPLAYING DATA
Vision provides a large number of graphical plots, allowing you to produce meaningful data from test
results.
Setting the Units
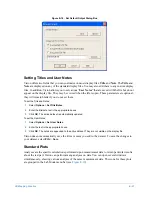
You may want to display your data in specific units or in a common unit system. By clicking the
Units
icon or by selecting
Options
>
Units
, you can display the
Units
dialog box. This dialog box
allows you to choose which units (English or metric) you prefer to use, and which magnitude you
prefer. This option can be set before the measurement and saved in the configuration file, or it can be
changed at any time after the measurement. In addition, you can set the units you choose as the
default for future measurements by selecting the
Set as Default
check box.
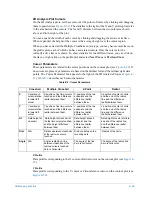
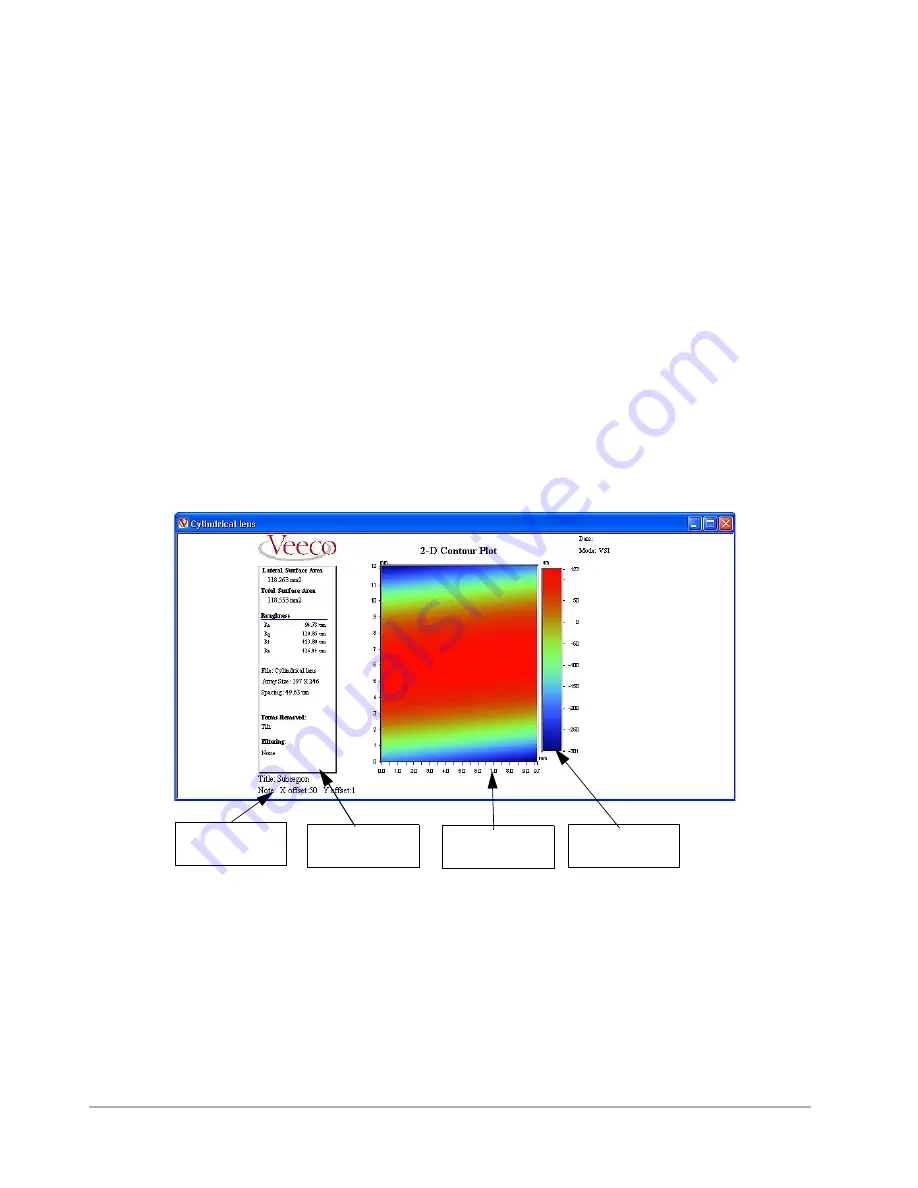
Standard Display File
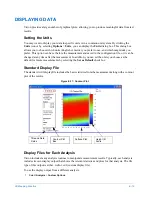
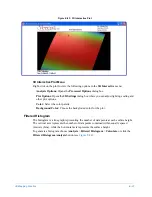
The standard .wdf display file includes the basic statistics from the measurement along with a contour
plot of the results.
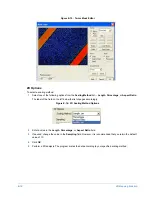
Figure E-17: Contour Plot
Display Files for Each Analysis
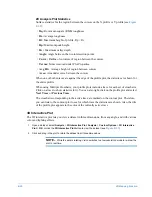
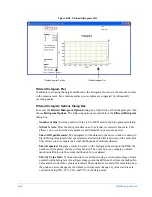
Vision includes many analysis routines to manipulate measurement results. Typically, each analysis
includes its own display output that shows the relevant statistics and plots for that analysis. The file
type of this output is either .wdf or .cdf (custom display file).
To use the display output from a different analysis:
1
Select
Analysis
>
Custom Options
.
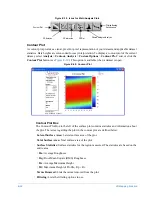
Title and Note
Fields
Contour Plot Box
Surface Plot
Height (Z)
Scale
Contour Plot
Box
Summary of Contents for Dektak 150
Page 1: ......
Page 7: ......
Page 17: ......
Page 81: ......
Page 105: ......
Page 149: ......
Page 191: ......
Page 251: ......
Page 257: ...A 6 Facilities Specifications Figure A 6 Dektak 150 without Enclosure Side View ...
Page 258: ...Facilities Specifications A 7 Figure A 7 Dektak 150 Dimensions without Enclosure Top View ...
Page 259: ...A 8 Facilities Specifications Figure A 8 Dektak 150 without Enclosure Center of Mass ...
Page 273: ......
Page 283: ......
Page 321: ......
Page 331: ......
Page 333: ......
Page 336: ......
Page 337: ......
Page 349: ......


