3D Mapping Function
E-23
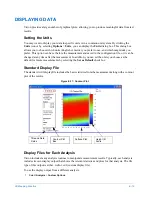
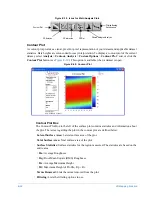
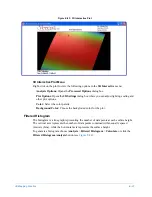
Surface Plot
A plot of the surface as viewed from directly above (see
). Surface heights are depicted
by the colors on the vertical height scale to the right of the plot.
Height (Z) Scale
A vertical height scale, centered about the mean height (see
). The scale relates colors (or
gray-scale levels) to the surface heights they represent. You can change the vertical scale with the
Output
>
User Limits
command.
•
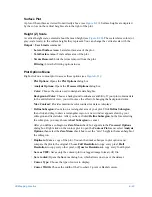
Lateral Surface Area:
Lateral surface area of the plot.
•
Total Surface Area:
Total surface area of the plot.
•
Terms Removed:
Lists the terms removed from the plot.
•
Filtering:
Lists the filtering options in use.
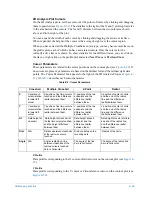
Plot Options Menu
Right-click on a contour plot to access these options (see
):
•
Plot Options:
Opens the
Plot Options
dialog box.
•
Analysis Options:
Opens the
Processed Options
dialog box.
•
Color:
Choose the colors used to designate data heights.
•
Background Color:
Choose a background to enhance readability. If your plot contains data
in the entire field of view, you will not see the effect of changing the background color.
•
Max Contrast:
Provides maximum color contrast for data set displays.
•
Define Subregion:
Zoom in on a rectangular area of your plot. Click
Define Subregion
,
then click and drag to draw a rectangular region. A new window appears showing your
subregion and its statistics. After you have clicked
Define Subregion
, but before selecting
the subregion, you may choose
Abort Subregion
to cancel.
After you define a subregion, a
Zero Mean
check box appears in the
Processed Options
dialog box. Right-click on the contour plot to open the
Contour Plot
menu, select
Analysis
Options,
then select the
Zero Mean
check box to set the “zero” height to the mean height of
the subregion.
•
Duplicate:
Make a copy of the plot. You can then make changes to plot options and
compare the plot to the original. Choose
Full Resolution
to copy every pixel,
Half
Resolution
to copy every other pixel, or
Quarter Resolution
to copy every fourth pixel.
•
Save as TIFF:
Saves only the contour plot to a tagged image format (.tif) file.
•
Save to disk:
Opens the
Save As
dialog box, which allows one to save the dataset.
•
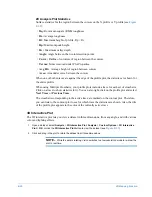
Cursor Type:
Choose the type of cursor to display.
•
Cursor Width:
Choose the width of the Crosshair, 2-point or Radial cursors.
Summary of Contents for Dektak 150
Page 1: ......
Page 7: ......
Page 17: ......
Page 81: ......
Page 105: ......
Page 149: ......
Page 191: ......
Page 251: ......
Page 257: ...A 6 Facilities Specifications Figure A 6 Dektak 150 without Enclosure Side View ...
Page 258: ...Facilities Specifications A 7 Figure A 7 Dektak 150 Dimensions without Enclosure Top View ...
Page 259: ...A 8 Facilities Specifications Figure A 8 Dektak 150 without Enclosure Center of Mass ...
Page 273: ......
Page 283: ......
Page 321: ......
Page 331: ......
Page 333: ......
Page 336: ......
Page 337: ......
Page 349: ......


