E-34
3D Mapping Function
blocks all the data inside the circle.
•
Pass:
Allows data to pass through area(s) that may have been previously blocked. For example,
if you create a blocked inner circle, select
Pass
, and then click on the
Inside
button, the program
will define a mask that passes the data within the circle.
•
Invert:
Used to invert the mask; exposed portions of your plot will be masked, and previously
masked portions will be exposed.
•
Inside:
Applies the selected function (
Block, Pass,
or
Invert
) to the inside of the area.
•
Outside:
Applies the selected function to the outside of the area.
•
Entire:
Applies the selected function (
Block, Pass,
or
Invert
) to the entire mask. May be used
at any time as long as a cursor tool is not in the process of being created. To erase the current
mask, you can select
Pass
and then click on
Entire
.
•
Undo:
Used to undo the most recent change made to the mask currently defined in the
Mask
Editor
window.
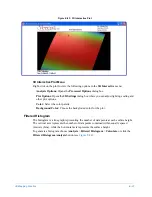
With a mask visible in the
Mask Editor
window, select
Mask Outline
to create an outline of the
mask on the dataset. You can then modify the identical, outlined mask. This is useful when you are
making measurements of samples in which identical features from sample to sample vary slightly in
size or position.
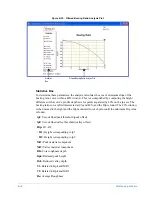
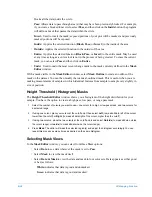
Height Threshold (Histogram) Masks
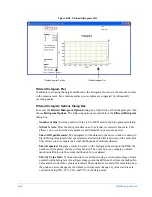
The
Height Threshold Editor
window shows you a histogram of the height distribution for your
sample. You have the option to create a high pass, low pass, or range pass mask.
1
Select the number of cursors you want to use—one cursor for a high or low pass mask, and two cursors for
a selected range.
2
If using one cursor, place your cursor at the cutoff point, then select
Left
(to mask all data left of the cursor,
lower than the cutoff) or
Right
(to mask all data right of the cursor, higher than the cutoff).
3
If using two cursors, place the two cursors at the cutoff points and select
Outside
(to mask all data outside
the cursor range) or
Inside
(to mask all data inside the cursor range).
4
Press
Mask
. The editor will mask the selected region(s) and adjust the histogram accordingly. You can
repeat this process as many times as desired on the same histogram.
Selecting Mask Views
In the
Mask Editor
window, you can select from three
View
options:
•
Select
Data
to see data wherever the mask is set to
Pass
.
•
Select
Mask
to view the mask itself.
•
Select
Data & Mask
to view the data and mask in four color sets. Data appears as either good
or bad, as follows:
•
White
indicates that data is good and unmasked.
•
Green
indicates that data is good and masked.
Summary of Contents for Dektak 150
Page 1: ......
Page 7: ......
Page 17: ......
Page 81: ......
Page 105: ......
Page 149: ......
Page 191: ......
Page 251: ......
Page 257: ...A 6 Facilities Specifications Figure A 6 Dektak 150 without Enclosure Side View ...
Page 258: ...Facilities Specifications A 7 Figure A 7 Dektak 150 Dimensions without Enclosure Top View ...
Page 259: ...A 8 Facilities Specifications Figure A 8 Dektak 150 without Enclosure Center of Mass ...
Page 273: ......
Page 283: ......
Page 321: ......
Page 331: ......
Page 333: ......
Page 336: ......
Page 337: ......
Page 349: ......


