8-24
Menu and Toolbar Descriptions
Levels the trace at the current R and M cursor intercepts.
Changes the zero position of the graph vertically to align with the intercept of the R cursor and the
plot.
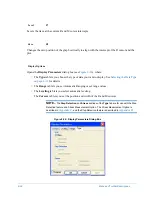
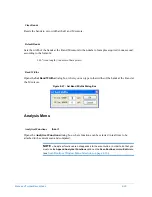
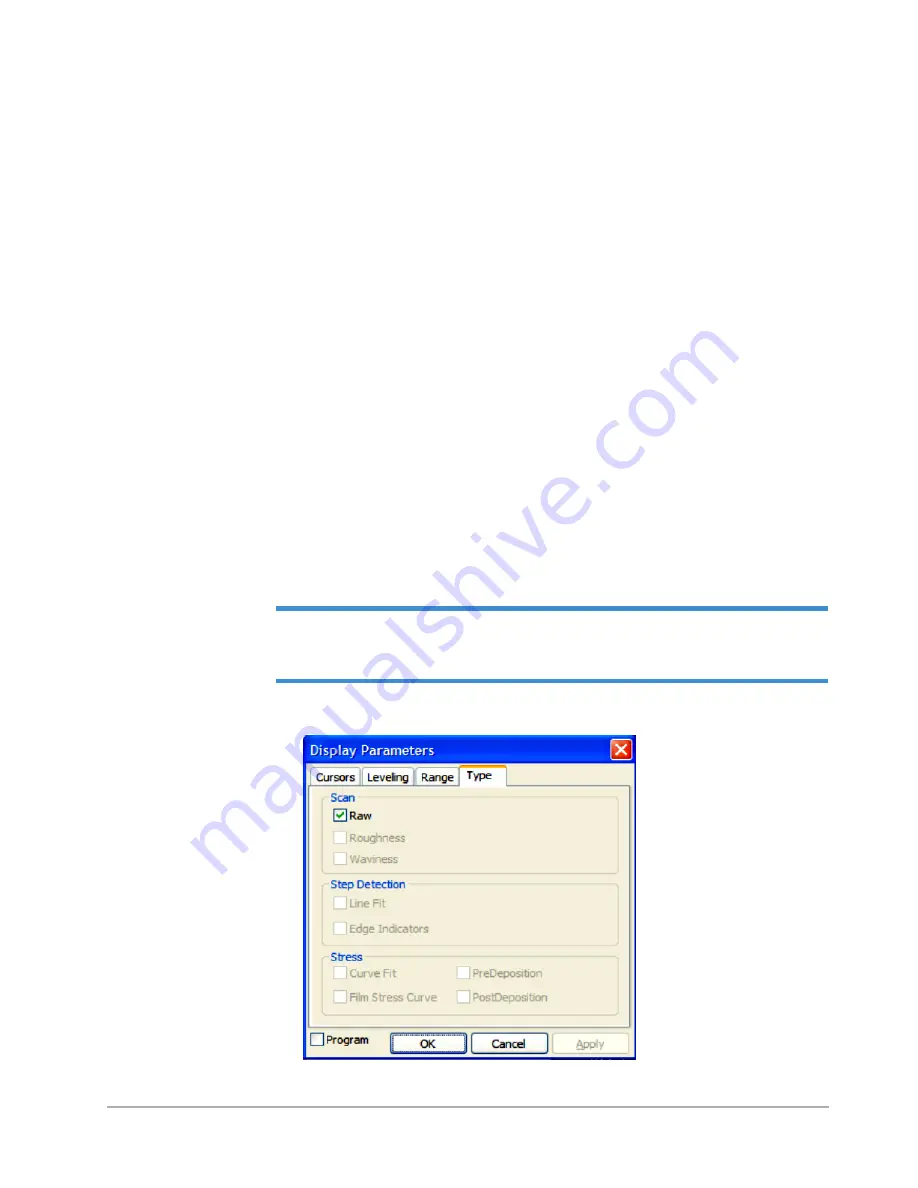
Opens the
Display Parameters
dialog box (see
Figure 8-26
), where:
•
The
Type
tab lets you choose the type of data you want to display. See
Selecting the Data Type
on page 6-13
for details.
•
The
Range
tab lets you set Automatic Ranging or set range values.
tab lets you select automatic leveling.
•
The
Cursors
tab lets you set the position and width of the R and M cursors.
NOTE –
The
Step Detection
and
Stress
sections of the
Type
tab are for use with the Step
Detection feature and Stress Measurement Option. The Stress Measurement Option is
described in
Appendix C
, and the Step Detection feature is described in
Appendix D
.
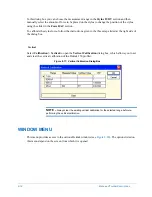
Figure 8-26: Display Parameters Dialog Box
Level
F7
Zero
F8
Display Options
Summary of Contents for Dektak 150
Page 1: ......
Page 7: ......
Page 17: ......
Page 81: ......
Page 105: ......
Page 149: ......
Page 191: ......
Page 251: ......
Page 257: ...A 6 Facilities Specifications Figure A 6 Dektak 150 without Enclosure Side View ...
Page 258: ...Facilities Specifications A 7 Figure A 7 Dektak 150 Dimensions without Enclosure Top View ...
Page 259: ...A 8 Facilities Specifications Figure A 8 Dektak 150 without Enclosure Center of Mass ...
Page 273: ......
Page 283: ......
Page 321: ......
Page 331: ......
Page 333: ......
Page 336: ......
Page 337: ......
Page 349: ......

