E-30
3D Mapping Function
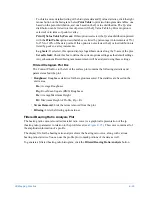
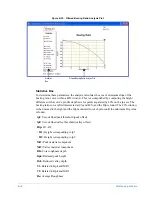
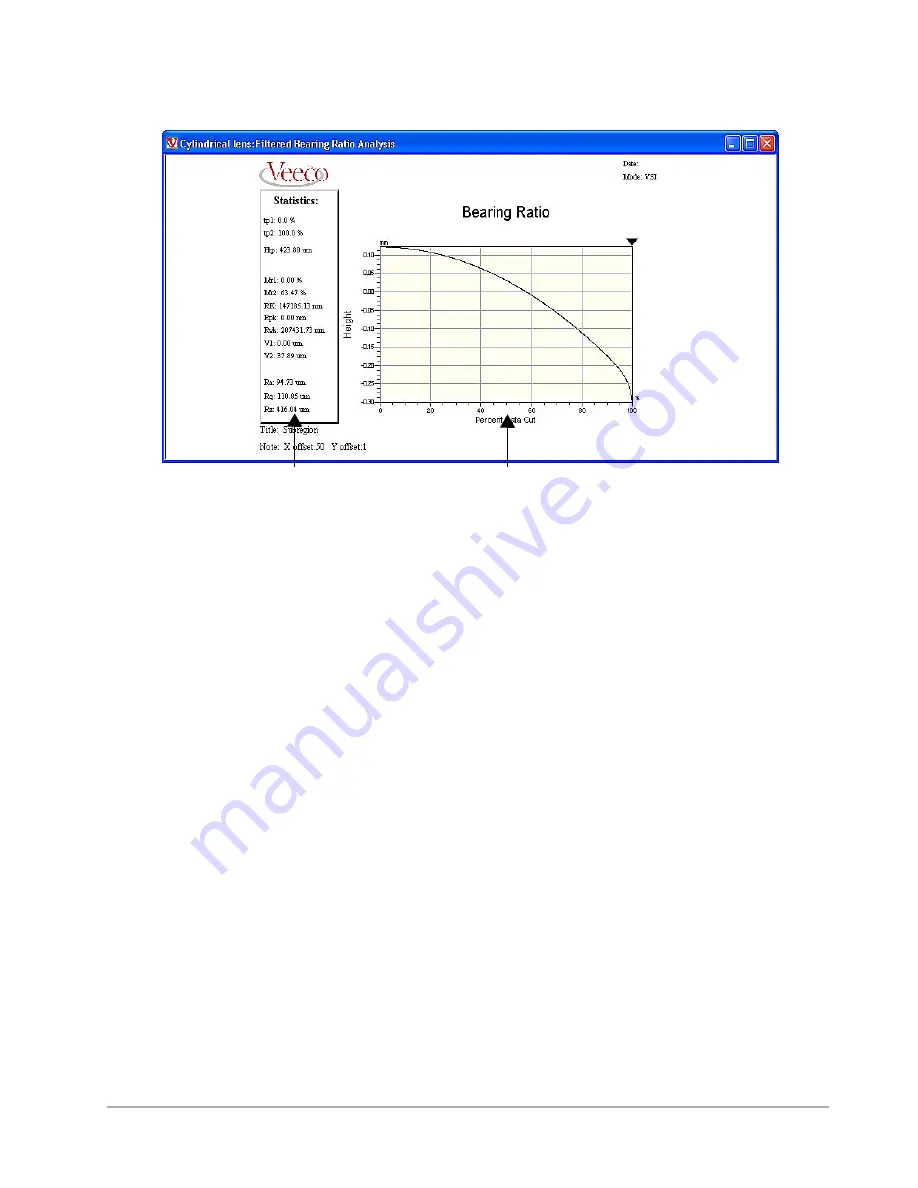
Figure E-25: Filtered Bearing Ratio Analysis Plot
Statistics Box
To determine these parameters, the analysis calculates the area of minimum slope of the
bearing ratio curve within a 40% window. This is accomplished by computing the height
difference of the curve’s profile depth axis for points separated by 40% on the tp axis. The
bearing ratio curve is first intersected at 0% and 40%, and the Htp is found. The 40% window
is then moved to the right and the Htp monitored for each point until the minimum Htp value
is found.
•
tp1:
User-defined peak threshold (peak offset)
•
tp2:
User-defined valley threshold (valley offset)
•
Htp:
H1 - H2
•
H1:
Height corresponding to tp1
•
H2:
Height corresponding to tp2
•
Mr1:
Peak material component
•
Mr2:
Valley material component
•
RK:
Core roughness depth
•
Rpk:
Reduced peak height
•
Rvk:
Reduced valley depth
•
V1:
Related to Rpk and MR1
•
V2:
Related to Rpk and MR1
•
Ra:
Average Roughness
Statistics
Box
Filtered Bearing Ratio Analysis Plot
Summary of Contents for Dektak 150
Page 1: ......
Page 7: ......
Page 17: ......
Page 81: ......
Page 105: ......
Page 149: ......
Page 191: ......
Page 251: ......
Page 257: ...A 6 Facilities Specifications Figure A 6 Dektak 150 without Enclosure Side View ...
Page 258: ...Facilities Specifications A 7 Figure A 7 Dektak 150 Dimensions without Enclosure Top View ...
Page 259: ...A 8 Facilities Specifications Figure A 8 Dektak 150 without Enclosure Center of Mass ...
Page 273: ......
Page 283: ......
Page 321: ......
Page 331: ......
Page 333: ......
Page 336: ......
Page 337: ......
Page 349: ......

