Single Scan Operation
4-17
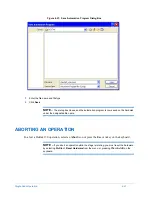
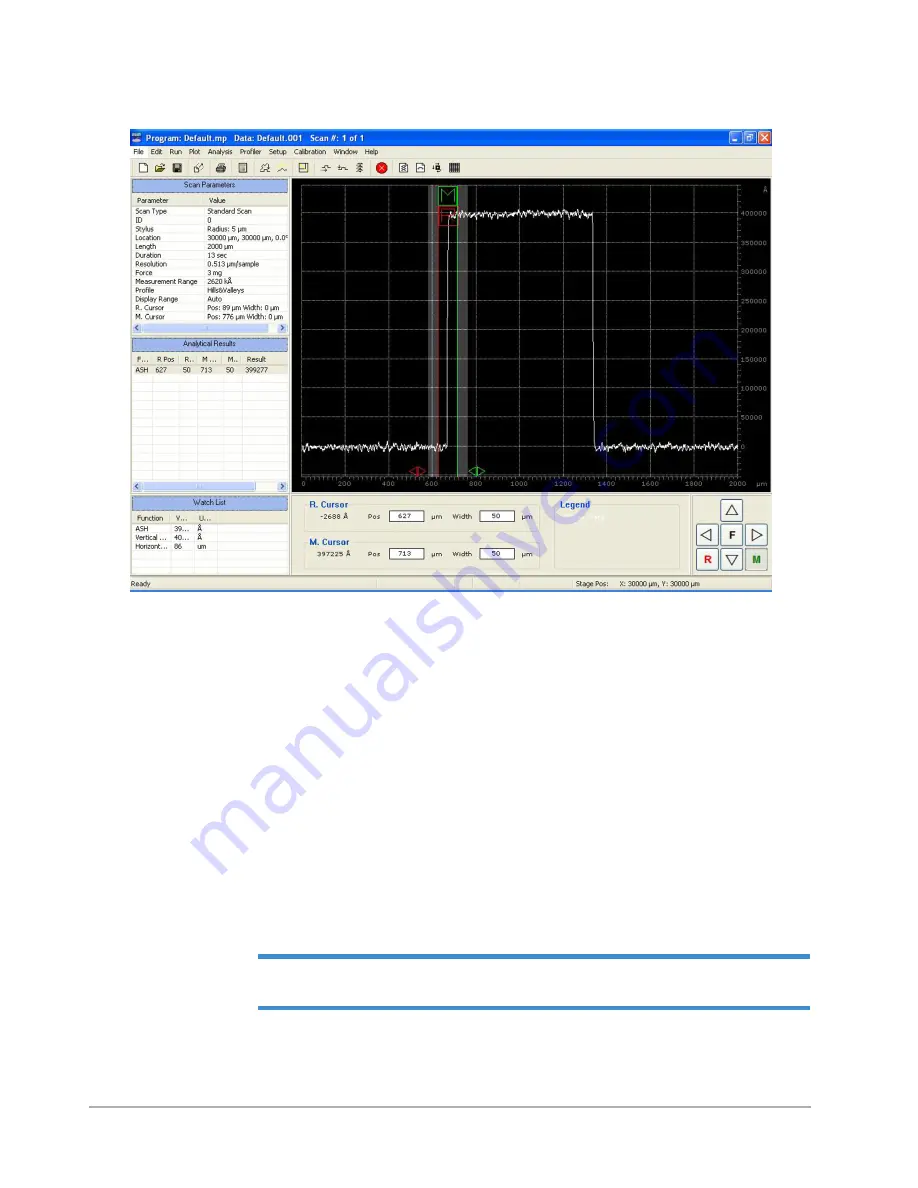
Figure 4-17: Step Height Measurement
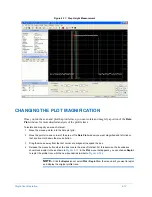
CHANGING THE PLOT MAGNIFICATION
Once you run the scan and plot the profile trace, you can isolate and magnify a portion of the
Data
Plot
window for more detailed analysis of the profile trace.
To isolate and magnify an area of interest:
1
Move the mouse pointer into the data plot grid.
2
Move the pointer to one corner of the area of the
Data Plot
window you want magnified and left-click on
that location. Hold down the mouse button.
3
Drag the mouse away from the first corner at a diagonal to expand the box.
4
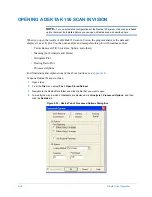
Release the mouse button when the box covers the area of interest. For this exercise, the boundaries
should look similar to those shown in
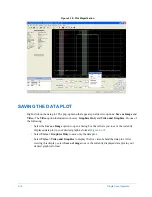
. In the
Plot
menu that appears, you can choose
Replot
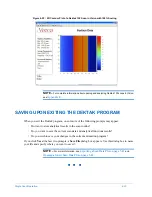
to replot the profile trace with the new boundaries (similar to
).
NOTE –
Click the
Replot
icon or select
Plot
>
Replot
from the menu bar if you want to replot
and display the original profile trace.
Summary of Contents for Dektak 150
Page 1: ......
Page 7: ......
Page 17: ......
Page 81: ......
Page 105: ......
Page 149: ......
Page 191: ......
Page 251: ......
Page 257: ...A 6 Facilities Specifications Figure A 6 Dektak 150 without Enclosure Side View ...
Page 258: ...Facilities Specifications A 7 Figure A 7 Dektak 150 Dimensions without Enclosure Top View ...
Page 259: ...A 8 Facilities Specifications Figure A 8 Dektak 150 without Enclosure Center of Mass ...
Page 273: ......
Page 283: ......
Page 321: ......
Page 331: ......
Page 333: ......
Page 336: ......
Page 337: ......
Page 349: ......

