TLS-450 Setup and Operation Screens Manual
91
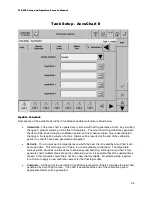
10. After at least 10 points are entered, the
Make Chart
button on the right of the screen will become
active. Touch this button to make the chart based on your entered points. Notice that the newly
created chart will appear in the report area of the screen and its
Status
will be 'Ready'.
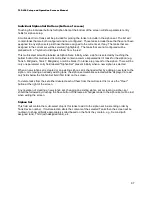
11. If this is the chart you want to use for the selected tank, touch the
Apply
button on the right side of
the screen to make the chart active for the selected tank. The 'Confirm Apply' dialog box will display,
touch the
Check
(OK) key to make this chart active for the selected tank. The
Warning Update
Schedule is active and may override your choice of active chart
message indicates that the Update
Schedule selection made in
tab screen may override this chart with an
AccuChart II calibrated tank chart.
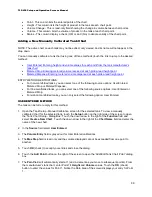
METERED DISPENSE METHOD
The tank should be full for this method.
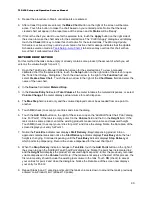
1. Open the Tank Setup - Manual Calibration screen for the selected tank. To view a manually
calibrated chart for the selected tank, touch the
Setup
button on the right side of the screen to open
the 'Tank Chart Setup - Dialog Box'. Touch the down arrow to the right of the
Function
field and
select
Create a New Chart
. Touch the down arrow to the right of the
Chart Name
field and enter the
name of the new chart.
2. In the
Source
field select
Metered Dispense
.
3. In the
Volume Entry
field select
Total Volume
if the meter totalizes the metered dispenses, or select
Volume Change
if the meter displays actual volume for each dispense.
4. The
Max Step
field is read only and the volume displayed cannot be exceeded from one point to
another.
5. Touch
OK
(check) to accept your entries and close the dialog.
6. Touch the
Add Point
button on the right of the screen to open the 'Add/Edit Tank Chart Point' dialog
box. For Point 1, enter the tank's full capacity in the
Volume
field and the tank's height in the
Height
field. Touch
OK
(check) to accept your entries for point 1 and close the dialog. Notice the Data Area
of the screen displays your entry for Point 1.
7. Notice the
Tank Idle
indicator now displays
Start Dispense
. Begin dispensing product into an
approved container/tank and notice the
Start Dispense
indicator displays
Tank Busy
while the fuel
height is changing. Continue dispensing until the
Tank Busy
indicator displays
Stop Dispense
at
which point stop dispensing. Record the volume dispensed for the next chart point.
8. When the
Stop Dispense
indicator changes to
Tank Idle
, touch the
Add Point
button on the right of
the screen to open the 'Add/Edit Tank Chart Point' dialog box. Notice the point has incremented to 2
and the
Heigh
t field displays the product's measured height at point 2. Enter the previously recorded
volume dispensed in the
Volume
field. Touch
OK
(check) to accept your entries for point 2 and close
the dialog. Notice the Data Area of the screen now displays your entry for Point 2.
9. Repeat Steps 6 and 7, entering points until the tank's volume is down to around the tank's previously
entered 'Low Product Limit' (at least 10 points).
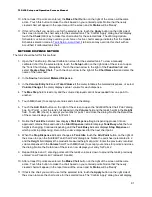
10. After at least 10 points are entered, the
Make Chart
button on the right of the screen will become
active. Touch this button to make the chart based on your entered points. Notice that the newly
created chart will appear in the report area of the screen and its
Status
will be 'Ready'.
11. If this is the chart you want to use for the selected tank, touch the
Apply
button on the right side of
the screen to make the chart active for the selected tank. The 'Confirm Apply' dialog box will display,

