Packet Tab
664
The events appear in a table that lists events, the number of events logged, the start
and stop time of the event, and the duration of the event.
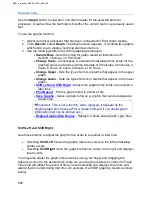
Select the
Descending
/
Ascending
button to toggle between the order you wish to view
the results.
Select
Pause
to temporarily halt the display of results, and press
Resume
to continue
displaying results in real-time.
Results - Large LEDs Screen
(Specifically for Fibre Channel SAN testing on the Packet tab)
This button displays the LED Error and Alarm Indicators in a large, easy to read format
that covers the entire screen area. This is especially useful for viewing any errors or
alarms from a long distance, such as across the room from a test bay.
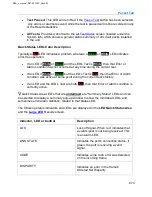
The following describes the LED colors:
If the LED color is ...
Then this indicates ...
Green
with
black
text
The specific function is active and OK.
Red
with
black
text
An error or alarm event is in progress.
White with
red
text
This function experienced an error or
alarm event. This event is cleared by
selecting Restart.
White with
black
text
No activity from this specific function.
For a list of available LEDs for Fibre Channel, see
Results - Graph Screen
(Specifically for Fibre Channel SAN testing on the Packet tab)
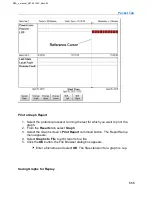
The Graph function allows incoming errors and alarms to be graphed. The graphs can
be saved, recalled, and printed from a history file.
MPA_e_manual_D07-00-129P_RevA00
Summary of Contents for MPA
Page 2: ...MPA_e_manual_D07 00 129P_RevA00...
Page 10: ...MPA_e_manual_D07 00 129P_RevA00...
Page 82: ...MPA_e_manual_D07 00 129P_RevA00...
Page 110: ...MPA_e_manual_D07 00 129P_RevA00...
Page 134: ...MLD Tab 134 100G RS FEC Ethernet 400G RS FEC Ethernet MPA_e_manual_D07 00 129P_RevA00...
Page 255: ...Protocol Tabs 255 MPA_e_manual_D07 00 129P_RevA00...
Page 256: ...OTN Tab 256 MPA_e_manual_D07 00 129P_RevA00...
Page 748: ...MPA_e_manual_D07 00 129P_RevA00...
Page 796: ...MPA_e_manual_D07 00 129P_RevA00...

