Protocol Tabs
743
Important: Once an alarm is selected, then alarm will
continuously insert until turned off.
4. If you want to clear any previously collected data, select
Restart
from the
common function button at the bottom of the screen before inserting the error.
5. View various result statistics by selecting the
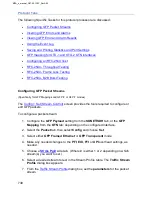
Viewing GFP Error and Alarm Results
(Specifically for GFP Mappings and GFP-F or GFP-T modes)
After
into a packet stream the receiving equipment detects
the event and reports it. The Results screen provides different result reports.
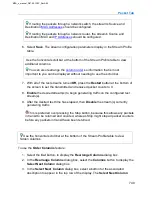
To view error or alarm results:
1. From the
Packet
tab, select
Results
.
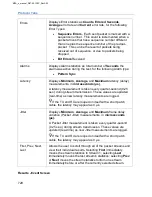
2. Select one of the following:
•
- Displays a list of errors and alarms along with their count and
duration.
•
- Displays a list of errors along with their count, errored seconds,
average and current rates.
•
- Displays a list of alarms along with the number of seconds spent
in the alarm condition.
•
- Displays Packet, VLAN, MPLS and Packet Size count statistics.
•
- Displays Stream ID specific statistics.
•
- Displays a summary of error alarm activity.
•
- Displays easy to read LEDs of error alarm activity.
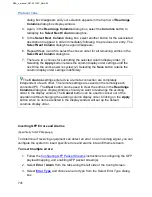
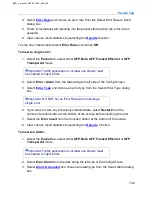
Recording in the Event Log
The Event Log is a table that displays events recorded by the unit. A scroll bar is
available, allowing you to scroll up and down to view an extended history.
To use the Event Log:
MPA_e_manual_D07-00-129P_RevA00
Summary of Contents for MPA
Page 2: ...MPA_e_manual_D07 00 129P_RevA00...
Page 10: ...MPA_e_manual_D07 00 129P_RevA00...
Page 82: ...MPA_e_manual_D07 00 129P_RevA00...
Page 110: ...MPA_e_manual_D07 00 129P_RevA00...
Page 134: ...MLD Tab 134 100G RS FEC Ethernet 400G RS FEC Ethernet MPA_e_manual_D07 00 129P_RevA00...
Page 255: ...Protocol Tabs 255 MPA_e_manual_D07 00 129P_RevA00...
Page 256: ...OTN Tab 256 MPA_e_manual_D07 00 129P_RevA00...
Page 748: ...MPA_e_manual_D07 00 129P_RevA00...
Page 796: ...MPA_e_manual_D07 00 129P_RevA00...

