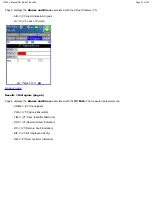
Level:
Measures the Peak and Peak-Peak voltage values of the incoming signal. The levels for the various signal types
according to ITU-T/GR.253 recommendations are presented.
8.1.5 Results > Analysis
ITU-T/ANSI recommendations are available to analyze results.
ITU-T G-series: Telecommunications design, checking of performance limits, expected behaviors and design structures
ITU-T M-series: Applies to the installation and maintenance of the network and defines “Bringing Into Service” (BIS) procedures
and test limits for fault detection and localization.
The ITU-T recommendations and are described in greater detail in the Measurements section.
8.1.6 Results > Histograms
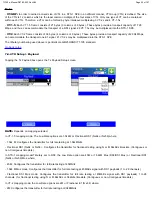
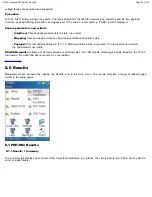
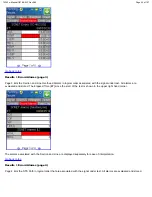
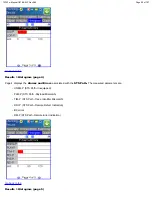
The Histogram tab brings up the screen displaying a historical record of the Alarms and Errors recorded during the measurement
interval. A dedicated page is available for errors, alarms including BER. Scroll through the various pages to display the anomalies
of interest. Followings are describe for E1 and Other modes are similar description as E1.
The alarms and errors presented will depend on the signal type and structure selected. A graphical timeline on the horizontal axis
indicates when the event occurred since the test was started. The upper left and right arrows allow the user to scroll through the
measurement period while the + and – keys allow zooming of the time axis. The events presented above are shown in the table
below.
TX150 e-Manual D07-00-023 Rev A02
Page 37 of 107

