Note:
The alarms and errors presented depend on the signal type and structure selected. A graphical timeline on the horizontal
axis indicates when the event occurred. The upper left and right arrows allow the user to scroll through the measurement period
while the + and – keys allow zooming of the time axis.
Results > Histogram (page 2)
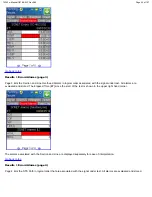
Page 2 displays the
Errors
associated with the
Section Overhead (SOH)
Results > Histogram (page 3)
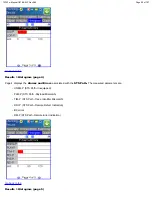
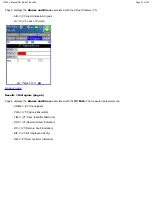
Page 3 displays the
Alarms and Errors
associated with the
STS PATH
. The measured parameters are;
- AIS-P, STS Path AIS
- LOP-P, STS Path LOP
TX150 e-Manual D07-00-023 Rev A02
Page 49 of 107


