Analog Channels
Direct channel tuning and positioning of visual and audio carriers
Visual and audio carrier level and frequency measurement
Survey of system visual and aural carrier levels and frequencies
Depth of modulation measurement
Audio carrier FM deviation measurement
Visual carrier-to-noise measurement
In-channel response measurement
Hum/low-frequency disturbance measurement
Intermodulation distortion measurement (CTB and CSO)
Digital Channels:
(applicable to QAM, QPSK, and OFDM signals)
Average power
Adjacent channel leakage (ACL)
CSO and CTB
Direct channel tuning and positioning of digital signal
Survey of system digital channel levels
System frequency response
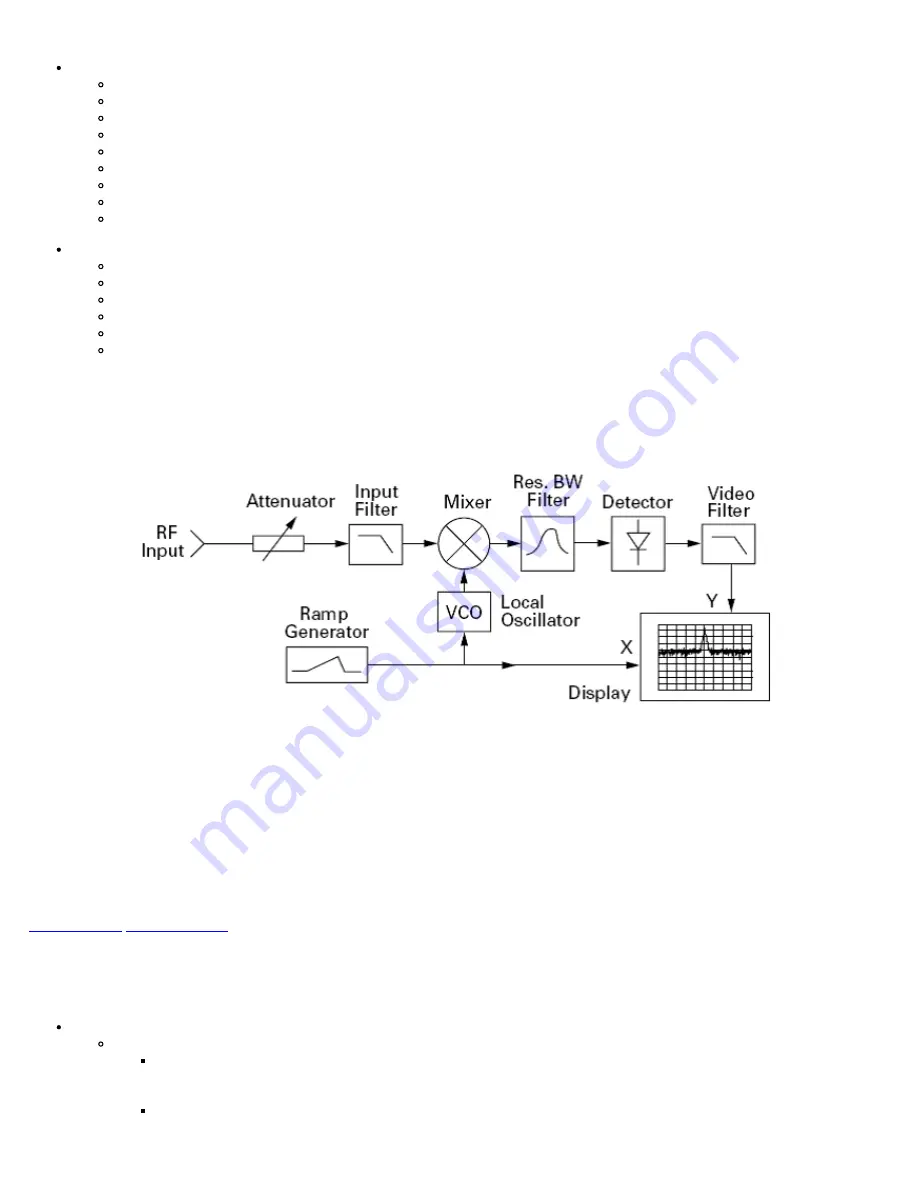
To understand the capabilities of the spectrum analyzer and the various elementary settings, it is important to have a basic understanding
of how a spectrum analyzer operates. Referring to the block diagram below:
Simplified Spectrum Analyzer Block Diagram
1. The RF input signal first travels through the attenuator and the low-pass input filter where the attenuator limits the amplitude of the
signal, while the filter eliminates undesirable frequencies.
2. After the input filter, the RF signal is mixed with another signal generated by a Voltage Controlled Oscillator (VCO) to produce an
intermediate frequency. The frequency of the VCO is controlled by a repeating ramp generator, whose voltage also drives the
horizontal axis of the display. As the frequency of the VCO changes, the intermediate frequency sweeps through the resolution
bandwidth filter (IF filter), which is fixed in frequency.
3. A detector then measures the power level of the signal passing through the IF filter, producing a DC voltage that drives the vertical
portion of the display. As the VCO sweeps through its frequency range, a trace is drawn across the screen. This trace shows the
spectral content of the input signal within a selected range of frequencies.
7.4.1 Setup
The following setup parameters are available:
Center Frequency (MHz) and Frequency Span (MHz)
The two selections are independent of each other and made on two separate settings.
The center frequency selection sets the frequency of the center of the scale to the chosen value - normally where the
signal to be monitored would be located. In this way, the main signal is in the center of the display and the
frequencies on either side can be monitored.
The span selection is the extent of the frequency coverage that is to be viewed or monitored on the display. Any
custom values can be entered. The display may show the default values of 2.4, 4.8, 7.2, and 9.6 MHz (for values of
less than 9.6MHz), however, the screen displays two vertical purple lines representing the entered span's frequency
Summary of Contents for VEPAL CX350S-D3.1
Page 1: ...CX350s D3 1 e Manual D07 00 102P RevA01 Page 1 of 109 ...
Page 13: ...Go back to top Go back to TOC CX350s D3 1 e Manual D07 00 102P RevA01 Page 13 of 109 ...
Page 16: ...Go back to top Go back to TOC CX350s D3 1 e Manual D07 00 102P RevA01 Page 16 of 109 ...
Page 21: ...Go back to top Go back to TOC CX350s D3 1 e Manual D07 00 102P RevA01 Page 21 of 109 ...
Page 57: ...Go back to top Go back to TOC 7 8 4 Remote Operations ...
Page 76: ...Go back to top Go back to TOC CX350s D3 1 e Manual D07 00 102P RevA01 Page 71 of 109 ...


