32
6 Set up with the display and adjustment module PLICSCOM
VEGACAL 66 • Foundation Fieldbus
30038-EN-200929
Measurement reliability
Sensor status
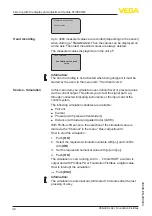
Up to 3000 measured values are recorded (depending on the sensor)
when starting a "
Trend curve
". Then the values can be displayed on
a time axis. The oldest measured values are always deleted.
The measured values displayed are in the unit pF.
Trend recording
Presentation of the trend
curve
Information:
The trend recording is not activated when being shipped. It must be
started by the user via the menu item "
Start trend curve
".
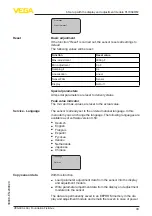
In this menu item you simulate a user-defined level or pressure value
via the current output. This allows you to test the signal path, e.g.
through connected indicating instruments or the input card of the
control system.
The following simulation variables are available:
•
Percent
•
Current
•
Pressure (with pressure transmitters)
•
Distance (with radar and guided radar (GWR))
With Profibus PA sensors, the selection of the simulated value is
made via the "Channel" in the menu "
Basic adjustments
".
How to start the simulation:
1. Push
[OK]
2. Select the requested simulation variable with
[->]
and confirm
with
[OK]
.
3. Set the requested numerical value with
[+]
and
[->]
.
4. Push
[OK]
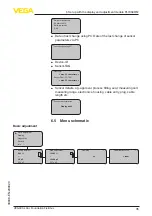
The simulation is now running, with 4 … 20 mA/HART a current is
output and with Profibus PA or Foundation Fieldbus a digital value.
How to interrupt the simulation:
→
Push
[ESC]
Information:
The simulation is automatically terminated 10 minutes after the last
pressing of a key.
Trend recording
Service - Simulation


