V-Sense
TM
Profile X1
©
User Guide
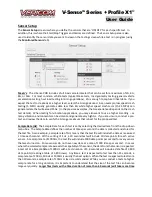
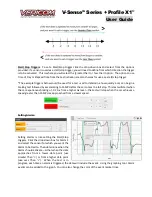
Edit Series
: The Edit Series tab is the primary set of tools that manage which data elements are shown
on the graph and how the y-axis is managed. With the Edit Series functions, you can add multiple y-axis
data elements to match the various data items selected. To view the slope of a test area, set the x-axis
to GPS Distance (the GPS Altitude sensor must be on during the test to show the slope of a test area).
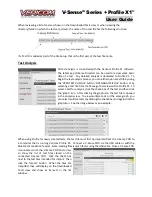
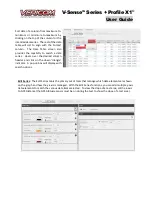
Sort data of a column from maximum-to-
minimum or minimum-to-maximum by
clicking on the top of the column for the
intended data series. The rest of the data
table will sort to align with the
‘
sorted
’
column. The Data Table screen also
provides the capability to search a data
series. Hover over the desired column
header and click on the down
‘
triangle
’
indicator. A pop-up box will display with
search options.


