V-Sense
TM
Profile X1
©
User Guide
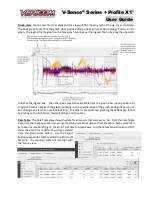
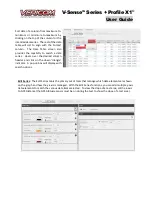
Map
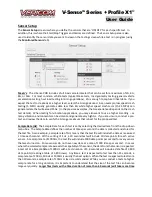
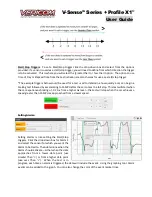
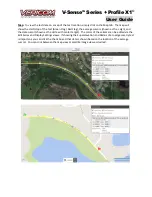
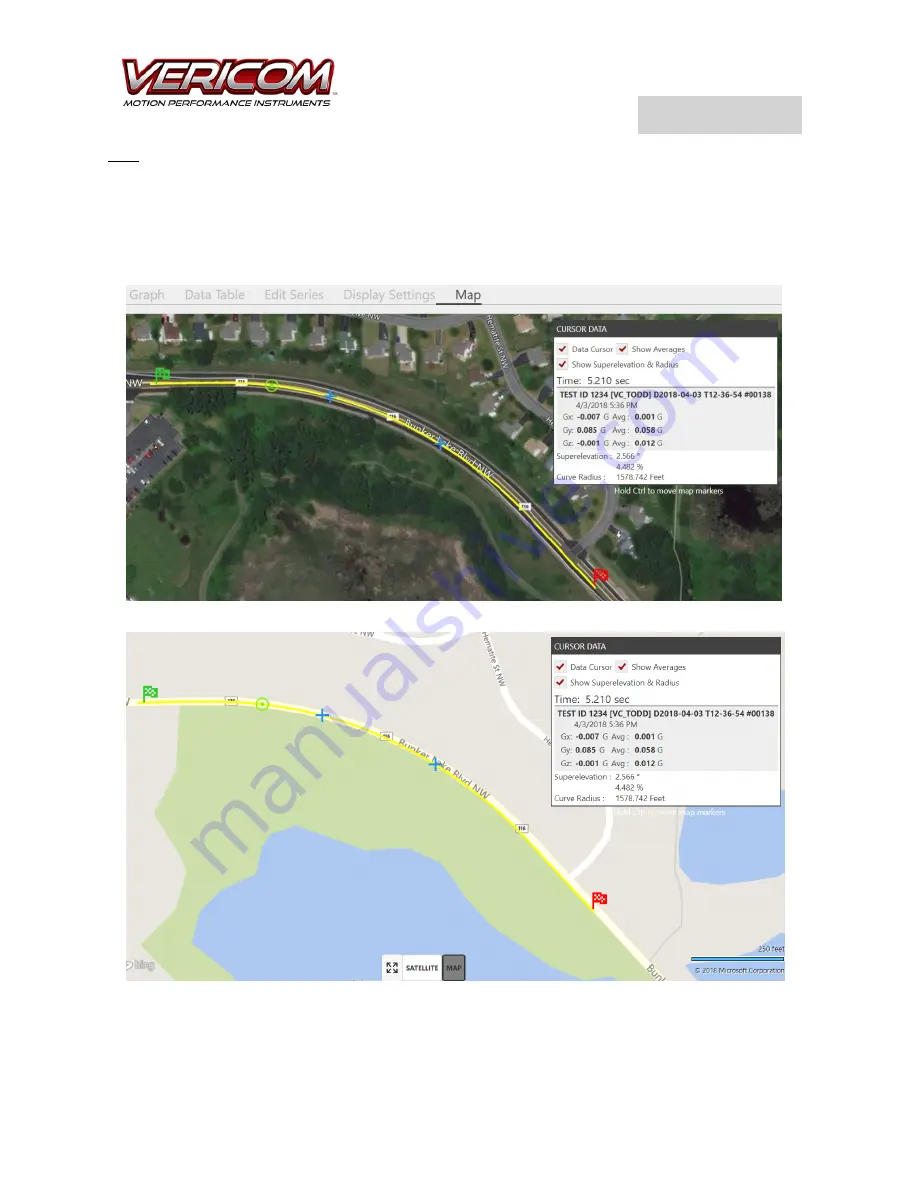
: To view the test data on a map of the test location, simply click on the Map tab. The map will
show the start/stop of the test (Green Flag / Red Flag), the average cursors (shown as the + sign), and
the data cursor (shown as the circle with center target). The colors of these items can be edited via the
Edit Series and Display Settings views. If showing the Superelevation and Radius of a road geometry test
is important, you can click the check box ad that data is shown based on the location of the average
cursors. You can click between the map view or satellite image view as desired.


