background image


V-Sense

TM

  Profile X1

©


User Guide 


Active  Test  View

:    After  the  File 

Setup and Sensor Setup are defined 
for  a  test,  start  the  test  from  the 
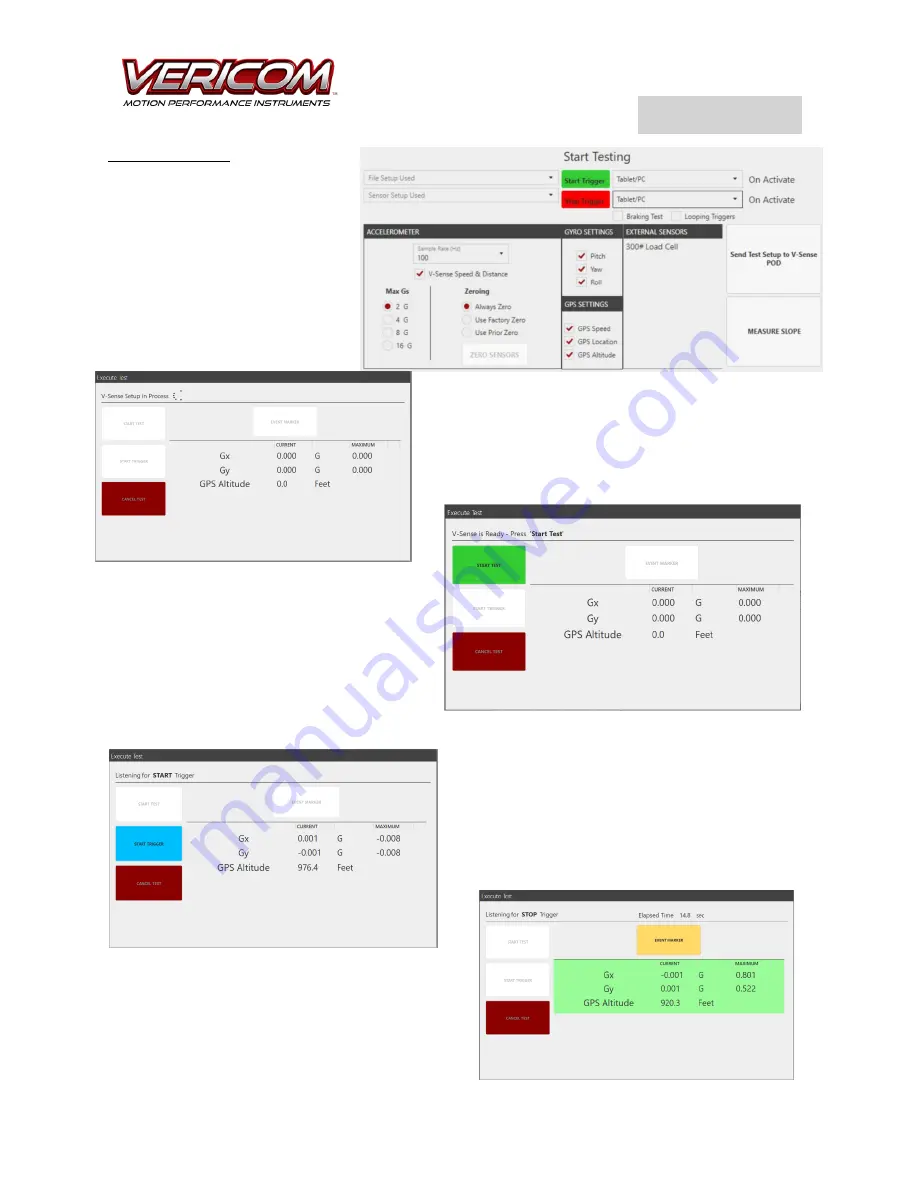
Start  Testing  screen.    Review  the 
basic  test  setup  information  as 
shown  on  the  Start  Testing  screen 
to  verify  the  setup  is  correct.    You 
can also select a new File Setup or 
Sensor Setup by selecting an option 
from the drop-down box. 
 

After clicking on the Send Test Setup button, the screen 
will  display  the  Execute  Test  viewer.    For  the  first  few 
seconds  (typically  3-10  seconds)  the  screen  will  show  a 

‘working  spinner’  that  is  active  while  the  POD  is  being 

configured for the test.  After the POD is ready, the screen 

will show the ‘Start Test’ view.  This means the 

POD is ready 


BUT the POD is not ‘listening’ for 

the Start Trigger.  When you are ready to set the 
POD  to  conduct  the  test,  click  the  Start  Test 
button.    Once  the  test  is  started,  the  view  will 
change to show the active data as being sensed 
by  the  POD.    Only  data  for  those  selected 

‘Monitored Sensors’ is displayed on the Execute 

Test screen. 

If  the  Start  Trigger  is  set  as  the  Tablet/PC,  the  start 

trigger  button  will  highlight  ‘blue.’    If  you  did  select 

Tablet/PC as the trigger, click that button when ready.  
After  the  Start  Trigger  is  sensed,  the  tablet/PC  will 
beep  and  the  background  of  the  sensor  data on  the 
screen is shown as green (to indicate test data is being 
collected and saved in the file). 

 
At  anytime  prior  to  the  Stop  Trigger  being  sensed, 
clicking the Cancel Test button will cancel the test (no 
data is saved - no test file is created).  At the end of 
the test (Stop Trigger)

, the screen will blink ‘red’ and 

the tablet/PC will beep. 

Summary of Contents for Profile X1

Page 1: ...n or off The light on the far left of the LED panel will illuminate when power is on The 4 LED lights on the right side of the LED panel indicate the battery level of the V Sense POD Connect a V Sense...

Page 2: ...onnecting a POD to the tablet Connect the micro USB end on the USB cable to the POD micro USB connector Connect the common USB end rectangular shape to the PC USB port The Profile X1 software includes...

Page 3: ...ty Use the File Setup screen to add context and information that you want to attach to the test file As desired you can add a Test ID Operator ID and additional description information for a specific...

Page 4: ...o verify the G range maximum that is best for the proposed test Sample Rate Hz The Sample Rate for each test is set by selecting the desired rate from the drop down menu box The Sample Rate defines th...

Page 5: ...sit brake testing drag factor tests for crash investigations and other similar straight line tests that last less than 2 10 seconds The V Sense Speed and Distance is also useful for drag racing applic...

Page 6: ...Trigger and or data that was collected a few moments after the Stop Trigger This setup option allows for adding data that was collected 0 50 100 150 and 200 milliseconds prior to or after the Start S...

Page 7: ...rating to 15 MPH after the car comes to a full stop This test will start when the car experiences braking of 0 2 Gx from a higher Gx level the test will stop when the car achieves a speed greater than...

Page 8: ...ofile X1 or V Sense POD When viewing tests stored on the connected V Sense POD you can elect to select an entire list of tests or specific test files to import to your PC You can also delete test file...

Page 9: ...ect a test for analysis click the check box of the test and then click the graph icon After clicking the graph icon the test file is opened in the analysis view To view multiple tests on the same grap...

Page 10: ...raph view as a new Analysis File The other more advanced graphing capabilities are found by clicking on the Edit Series Display Settings and Map tabs Data Table The Data Table view shows the data for...

Page 11: ...t area set the x axis to GPS Distance the GPS Altitude sensor must be on during the test to show the slope of a test area Sort data of a column from maximum to minimum or minimum to maximum by clickin...

Page 12: ...est object rotates significantly while accelerating As an example a larger truck or bus will often have significant forward pitch rotation when testing for braking stopping capability Using the Rotati...

Page 13: ...shown as the sign and the data cursor shown as the circle with center target The colors of these items can be edited via the Edit Series and Display Settings views If showing the Superelevation and R...

Page 14: ...BUT the POD is not listening for the Start Trigger When you are ready to set the POD to conduct the test click the Start Test button Once the test is started the view will change to show the active da...

Reviews: