A
cc
id
en
t
R
eco
n
U
se
VC4000 Manual
22
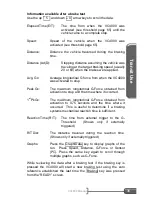
Speed:
Speed of the vehicle when the VC4000 was
activated (see threshold page 65).
Distance:
Distance the vehicle traversed during the braking
time.
Avg. Gx*:
Average longitudinal G force from when the VC4000
was activated to stop.
Avg. Gy:
Average lateral G force from when the VC4000 was
activated to stop.
Peak Gx:
The maximum longitudinal G-Force obtained from
activation to stop and the time where it occurred.
Peak Gy:
The maximum positive and negative lateral G-Force
obtained from activation to stop.
Reaction Time (R/T):
The time from external trigger to the G-
Threshold. (Shows only if externally
triggered)
R/T Dist:
The distance traveled during the reaction
time. (Shows only if externally triggered)
G(x.x):
The instantaneous G-Force at the corresponding
time.
Graphs:
Press the Graph/Data key to display graphs of the
run. Press Speed, Distance, G-Force, or Sensor.
Press the same key again to scroll through multiple
graphs, such as G-Force or Sensor.
* The VC4000's Average G force (Drag Factor) is calculated by
summing
the G values and dividing by the number of samples. This
will give the same result as using velocity and time.
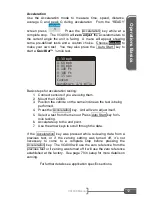
While reviewing the data after a braking test if the braking key is
pressed the VC4000 will start a new braking test using the zero
reference established the last time the Braking key was pressed
from the “READY” screen.

