30
Energy monitoring
- Exceeding the monthly
threshold
is signalled by a small red icon that appears above the bars of the his-
togram (the icon is displayed from the moment when the threshold is exceeded until the end of the month).
■
QUANTITATIVE CONSUMPTION ICON
in this case, too, the graphic appearance of the icon varies according to the type of contract made.
Time slot contract
- Average consumption: displayed in grey
- Estimated consumption: green
icon.
- Actual consumption: displayed in green.
To represent the three possible time slots, different shades of green are used going from pale green for slot
1 to dark green for slot 3.
If the average consumption is exceeded, the icon will turn yellow.
Threshold contract
- Average consumption: displayed in grey.
This value represents the threshold of the expected consumption.
- Actual consumption: displayed in green (single shade).
The icon turns yellow if the threshold is exceeded.
- Exceeding the monthly
threshold
is signalled by a small red icon that appears above the icon
Quantitative consumption (this happens only if the monthly consumption is displayed).
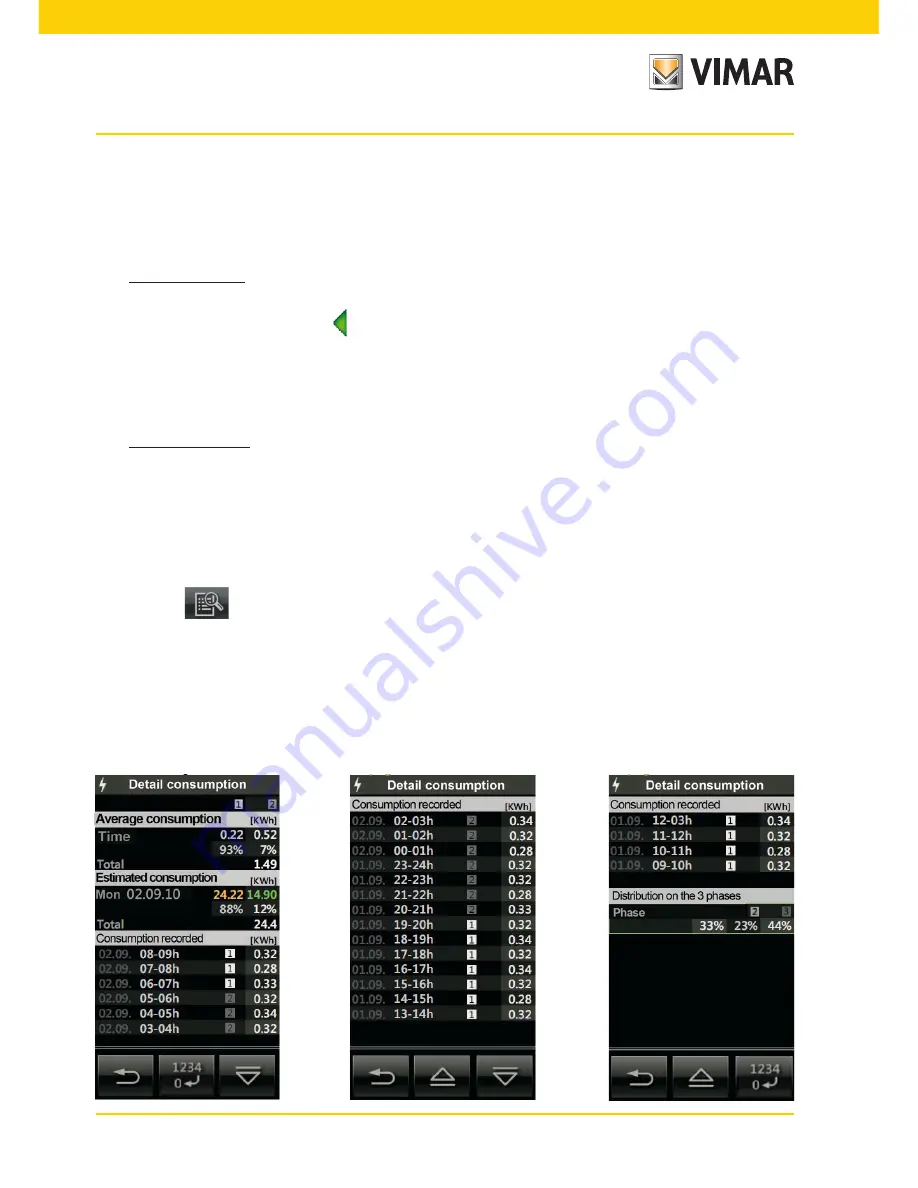
• Tapping the
icon displays the detailed consumption screens according to the set unit of measurement
and time scale.
It is possible to manage electric power supply contracts with 1, 2 or 3 time slots or threshold contracts,
for which there is a monthly maximum of energy consumption (beyond which the cost of the energy
increases).
Finally, for three phase systems only, at the end of the third screen the percentage distribution of the energy accu-
mulated by each phase is displayed.
Summary of Contents for 14511.1
Page 2: ......
Page 29: ...27 Energy monitoring ...


