© 2020 Virginia Diodes, Inc.
—All Rights Reserved
7 October 2020
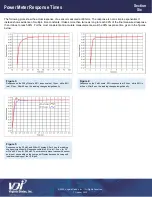
The following plots show the actual response of a sensor measured at 90 GHz. The response is not a simple exponential. It
instead shows evidence of multiple time constants. It takes more than twice as long to reach 99% of the final measured response
than it does to reach 90%. For the most consistent and accurate measurements, wait the 99% response time given in the figures
below.
Figure 3:
Response on the 200 µW scale. 90% response is at 12 sec. while 99%
is at 31 sec. After 60 sec. the reading changes insignificantly.
Figure 4:
Response on the 2 mW scale. 90% response is at 0.6 sec. while 99% is
at 5 sec. After 8 sec. the reading changes insignificantly.
Figure 5:
Response on the 20 mW and 200 mW scales. After 3 sec. the reading
changes insignificantly. Response settled to 99% is at 1.0 sec. for 20
mW and 0.4 sec. for 200 mW. The overshoot amount varies with sensor,
and is not observable on the front panel Display because it averages 8
individual readings of the USB port.
Section
Six
Power Meter Response Times


