flowscreen
Operating Instructions
Copyright ©
Version 1.0
13 / 24
3.5.3
Diagram, size in display
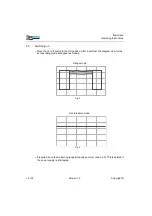
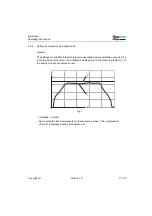
• Determine the dosing to measured in seconds.
• Determine the maximum dosing pressure*.
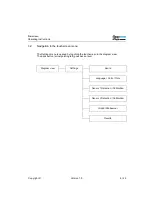
• Set diagram size: <
Settings
> <
Graph / Webserver
> <
Graph
>
-
max. X-Value
= Duration of the dosing in seconds, plus approx. 20%
-
max. Y-Value
= Maximum dosing pressure in bar
1
, plus approx. 20%
* Tip: If the pressure development for the dosing process is unknown, the pressure can
be read off from the display. Follow: <
Settings
> <
Sensor X Selection / Calibration
> in
<Current Value>
to display the value measured by the sensor. The maximum readable value in a
representative dosing can be used as an approximate Y-value.
3.5.4
Select operating mode
Determine whether the flowscreen analysis system should analyse measurement ranges
or overpressure: <
Settings
> <
Graph / Webserver
> <
Graph
> <
Mode
>
Selection:
1.or psi. depending on setting
Range
Pressure monitoring within set tolerances
Overpressure
Overpressure monitoring
Summary of Contents for flowscreen
Page 1: ...Operating Instructions flowscreen ...
Page 2: ......

