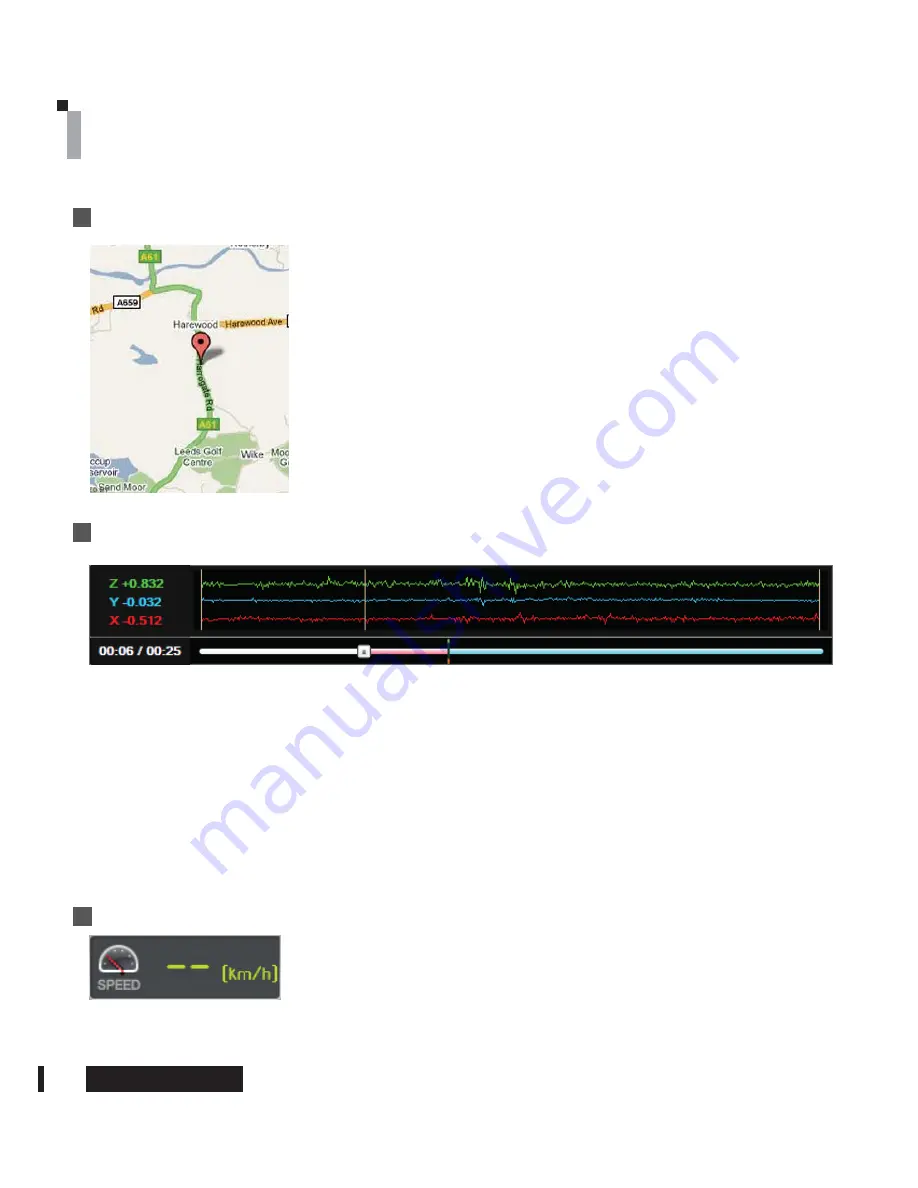
- With the saved GPS data, the map shows the location of the
vehicle while playing the video.
- The Google map is viewable only while your PC is connected to
the Internet and only when the recorded video has GPS data
associated with it.
- While the file is being played, the speed meter will show the vehicle’s speed that was
collected by the GPS.
SPEED METER
22
PC Analysis Program Use
visiondrive.co.kr
Positioning on the map
Shock Sensor Graph
- The graph below shows impacts on the x-y-z axes of the vehicle.
· X-axis : measures and records impacts from the front and back of the vehicle
( 0G ~ +/-3G is registered)
· Y-axis: measures and records impacts from the left and right sides of the vehicle
( 0G ~ +/-3G is registered)
· Z-axis: measures and records impacts from the top and lower part of the vehicle(up and down)
( 0G ~ +/-3G is registered)
- The bottom left displays a progress bar showing the time line of the video.
- Vertical line can be marked at the point of an impact.
- The red line is before the impact, the blue line is the time after impact.


