Page 18 of 32
V1682OPMA.doc
17 February, 2005
b
d
c
e
f
a
b
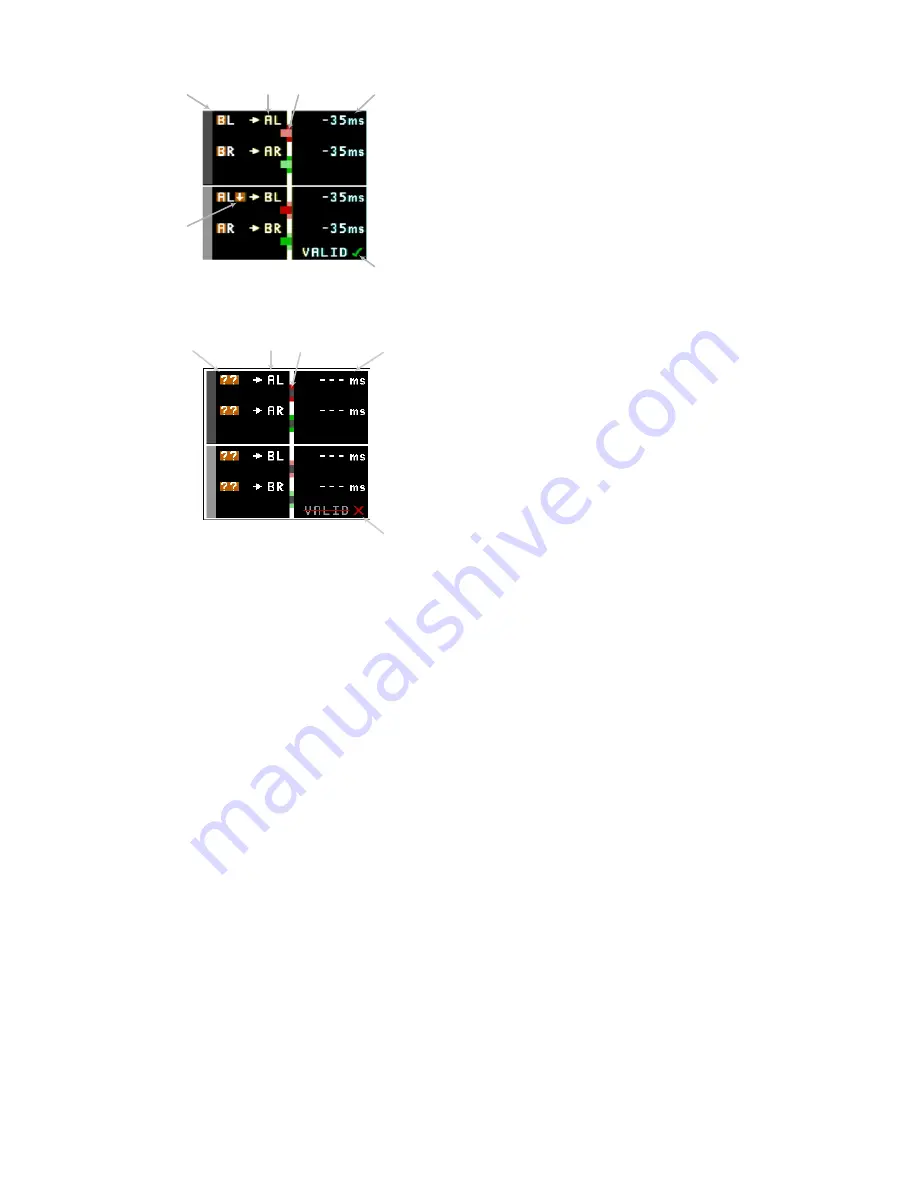
Figure 4.3 – Channels A and B swapped over, audio 35ms earlier than video, with
audio on BL input is inverted.
a
b
d
c
e
Figure 4.4 - Display with no, or non-VALID SDI input.
It is of obvious importance to understand the direction of the delay measurements. The delay
reported is that from the video to the audio i.e. the more positive the number, the later the audio.
The delay bars indicate that the audio is later than the video if extending right, and earlier if
extending left from the centre column.
4.6.4 PPM Audio Level Meters
An audio PPM level meter (conforming to IEC 60268-10 Type IIb) is provided on the right hand side
of the on screen display. The meter has a fixed range of –14 to +14 dBu, with scale markings at 4
dBu intervals as shown Figure 4.5. The green to yellow, and yellow to green transitions are at
+8dBu and +12dBu respectively.
The audio channels represented by the PPM meter are from left to right :
Channel A left, Channel A right, Channel B left, Channel B right.
In AES terms the meters represent channels 1 to 4 from left to right.
a - Unknown source channel
b - V1682 input
c - Delay bar showing unknown
d - Unknown video to audio delay
e - VALID struck through, and cross, indicating VALID test-
pattern has not been detected.
a - V1681 output
b - V1682 input
c - Delay bar
d - Video to audio delay in milli-seconds
e - VALID and tick, indicating VALID test-pattern detected.
f - Audio inversion symbol


