100
2801/2802 Power Analyzer User Guide
•
The
Harmonics
BARGRAPH data will print separate bar charts for ABS, %, Lin
or Log for current or voltage.
•
For the
Waveforms
group, volts, amps and power waveforms will print together
if a graphical print is selected. If a text only printer is selected, then volts and
amps will print together.
•
Voltage and current
Waveforms
for PEAK, DIST and GLITCH captures will
print separately.
•
Each
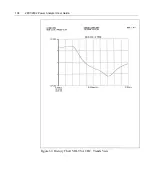
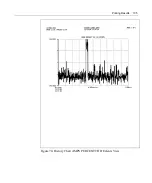
History
display will print a full page of graphically formatted data.
.
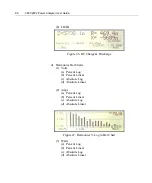
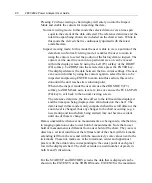
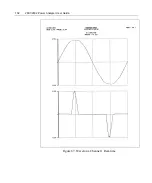
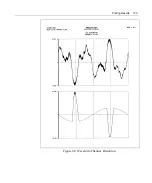
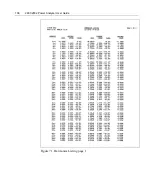
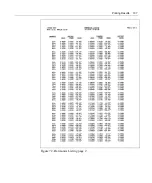
The following pages illustrate the sample printouts.
Summary of Contents for Xitron 2801
Page 1: ...USER GUIDE 2801 2802 Advanced Single and Dual Channel Power Analyzers...
Page 2: ...2 2801 2802 Power Analyzer User Guide...
Page 10: ...10 2801 2802 Power Analyzer User Guide...
Page 101: ...Printing Results 101 Figure 66 Configuration Printout...
Page 102: ...102 2801 2802 Power Analyzer User Guide Figure 67 Waveform Channel 1 Real time...
Page 103: ...Printing Results 103 Figure 68 Waveform Channe1 Distortion...
Page 104: ...104 2801 2802 Power Analyzer User Guide Figure 69 History Chart VOLTS ACDC Trends View...
Page 105: ...Printing Results 105 Figure 70 History Chart AMPS PERCENT THD Extents View...
Page 106: ...106 2801 2802 Power Analyzer User Guide Figure 71 Harmonics Listing page 1...
Page 107: ...Printing Results 107 Figure 72 Harmonics Listing page 2...
Page 145: ...Sending Commands and Interrogatives 145...
Page 147: ...Appendix A Physical Specifications 147...

