Display Screens
89
off the line switch at any time; this has no affect on the collection of
data for the Startup and Inrush Charts. In this mode, if the user has
selected to use the Internal Line Switch (either DC or AC mode), and
the user has enabled auto-range on the current input, then the
2801/2802 automatically selects the uppermost range of the selected
current input just before it actually turns on the line switch. It then
returns the range to that selected by the user when either the inrush
chart has been fully collected or the line switch is turned off by the
user, whichever occurs first. The operation is the same when a range is
fixed, but the user has disabled strict ranging,
Line Switch Enabled and Inrush Detection Enabled
This is similar to the case with the Line Switch Enabled and the Inrush
Detection disabled, described above, the only difference being the addition of
not starting data collection until the Inrush detection level has been exceeded
after the line switch has been turned on by the user. Note that the current must
be below the Inrush detection level for at least 20ms before the 2802 will
allow a new chart to be started. If the current is not below this level prior to
turning on the line switch, no Startup or Inrush data collection will occur (the
line switch will operate, however).
Chart Formats
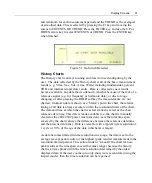
There are Chart display screens for History, Startup and Inrush data. The chart
screens include a labeled axis, the actual chart data plotted graphically, and
descriptive information regarding the chart. Optional chart data is available
through using the softkeys, which are labeled at the bottom.
The chart gives a graphical representation of the selected measurement results
plotted over time. The charts use time as the x-axis, with earlier time being to
the left and later to the right. The y-axis automatically scales to give the
fullest resolution for that measurement, with both the upper and lower limits
adjusted dynamically. In all cases, the upper limit is greater than the lower
limit.
Viewing Modes
There are two x-axis modes of viewing the chart data,
Normal
and
Inspect
.
These two viewing modes are accessed using the CURSOR F2 softkey.
Summary of Contents for Xitron 2801
Page 1: ...USER GUIDE 2801 2802 Advanced Single and Dual Channel Power Analyzers...
Page 2: ...2 2801 2802 Power Analyzer User Guide...
Page 10: ...10 2801 2802 Power Analyzer User Guide...
Page 101: ...Printing Results 101 Figure 66 Configuration Printout...
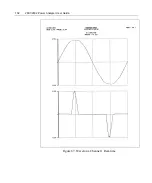
Page 102: ...102 2801 2802 Power Analyzer User Guide Figure 67 Waveform Channel 1 Real time...
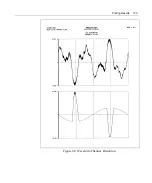
Page 103: ...Printing Results 103 Figure 68 Waveform Channe1 Distortion...
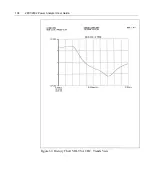
Page 104: ...104 2801 2802 Power Analyzer User Guide Figure 69 History Chart VOLTS ACDC Trends View...
Page 105: ...Printing Results 105 Figure 70 History Chart AMPS PERCENT THD Extents View...
Page 106: ...106 2801 2802 Power Analyzer User Guide Figure 71 Harmonics Listing page 1...
Page 107: ...Printing Results 107 Figure 72 Harmonics Listing page 2...
Page 145: ...Sending Commands and Interrogatives 145...
Page 147: ...Appendix A Physical Specifications 147...

