90
2801/2802 Power Analyzer User Guide
Pressing F2 when viewing a chart display will enter you into the Inspect
Mode and enable the cursors for inspecting the data..
Normal viewing mode: In this mode the selected data covers a time span
equal to the extent of the data collected. The reference date/time and the
total time span being shown are included on the chart screen. While in
this mode the viewed chart is continuously updated with the latest
available data.
Inspect viewing mode: In this mode the user is able to view a portion of the
data shown in Normal viewing mode. It enables the user to zoom in
using the cursors to select the portion of the history data to inspect. The
cursors can be used to zoom in to a particular area or can be moved
within the display screen by using the Left (F3) softkey or the RIGHT
(F4) softkey. To ZOOM into the selected area press the ENTER key,.
The displayed data is the data between the two cursor settings. The user
can zoom in further by using the cursors again to select the area to be
inspected and pressing ENTER to zoom into this section, this can be
done until the unit reaches its resolution point.
When in the inspect mode the user can use the ZOOM OUT (F3)
softkey to ZOOM back out a level at a time or can use the FULL-SPAN
(F4) key to exit back to the normal viewing screen.
The reference date/time, the time offset to the leftmost data displayed
and the time span being displayed are all included on the chart. The
data viewed in this mode is only computed when the scroll offset or the
zoom level is changed, thus any changes to the chart occurring (e.g. a
new startup and inrush chart being started) may not become evident
until one of these is changed.
Data is unavailable whenever no measurements are being made, whether due
to ranging operation or due to user hold of measurements. Note that a user
hold of measurements is different from a user hold of the chart. The y-axis is
drawn as a vertical solid line at the leftmost end of the chart, with tick marks
extending left from the axis and with the associated y scale values next to the
tick marks. These tick marks are at the lowermost, center and uppermost
pixels, with the actual value corresponding to the center point of each pixel
row in the displayed chart. The chart extends to an odd number of pixels in
both X and Y directions.
For the STARTUP and HISTORY screens the data that is displayed can be
shown in the EXTENTS or the TRENDS mode. EXTENTS is the maximum
Summary of Contents for Xitron 2801
Page 1: ...USER GUIDE 2801 2802 Advanced Single and Dual Channel Power Analyzers...
Page 2: ...2 2801 2802 Power Analyzer User Guide...
Page 10: ...10 2801 2802 Power Analyzer User Guide...
Page 101: ...Printing Results 101 Figure 66 Configuration Printout...
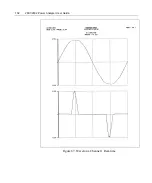
Page 102: ...102 2801 2802 Power Analyzer User Guide Figure 67 Waveform Channel 1 Real time...
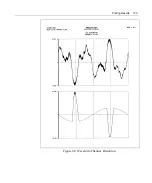
Page 103: ...Printing Results 103 Figure 68 Waveform Channe1 Distortion...
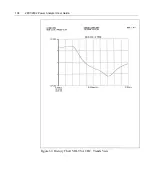
Page 104: ...104 2801 2802 Power Analyzer User Guide Figure 69 History Chart VOLTS ACDC Trends View...
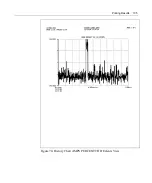
Page 105: ...Printing Results 105 Figure 70 History Chart AMPS PERCENT THD Extents View...
Page 106: ...106 2801 2802 Power Analyzer User Guide Figure 71 Harmonics Listing page 1...
Page 107: ...Printing Results 107 Figure 72 Harmonics Listing page 2...
Page 145: ...Sending Commands and Interrogatives 145...
Page 147: ...Appendix A Physical Specifications 147...


