Display Screens
91
and minimum for each measurement period and the TREND is the averaged
or smoothed data. This is selected by pressing the F1 key and moving the
cursor to EXTENTS OR TREND. Press the ENTER key and use the UP or
DOWN arrow key to select EXTENTS or TREND. Press the ENTER key
when finished.
Figure 51. No Inrush Detected
History Charts
The History chart is always running and does not need configuring by the
user. The data collected by the History chart is all of the basic measurement
results (e.g. Vrms, Vac, Vdc, Arms, Watts) including fundamental, percent
THD, and internal temperature results. Data is collected as new results
become available, any data that is unknown, whether because of the lack of a
reference signal (e.g. for frequency or harmonic data), or due to range
changing, or after pressing the HOLD softkey the measurements, are not
charted. Unknown data is shown as a “blank” spot in the chart, the relative
timing of all data is always accurate within the resolution limits of the chart.
The date and time at which the chart was last started is saved as the chart
reference date/time. This date is made available (i.e. the chart is manually
cleared or the 2801/2802 power was turned on), as is the total time span
covered by the chart (always the difference between the reference date/time
and the present date/time). Data is viewable with a typical time resolution of
1 cycle or 0.1% of the age of the data (whichever is larger).
As data becomes limited in time resolution due to age, the data is set to the
average (except peak results) or the highest (peak results) measurement in the
resolution limited period. This action tends to “smooth” the chart for non-
peak results as the time span covered becomes longer because the history
chart is always plotted with the time resolution determined by the oldest
displayed data. If the user zooms in to only show more recent data (using the
inspect mode), then the time resolution can be regained.
Summary of Contents for Xitron 2801
Page 1: ...USER GUIDE 2801 2802 Advanced Single and Dual Channel Power Analyzers...
Page 2: ...2 2801 2802 Power Analyzer User Guide...
Page 10: ...10 2801 2802 Power Analyzer User Guide...
Page 101: ...Printing Results 101 Figure 66 Configuration Printout...
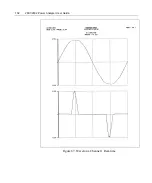
Page 102: ...102 2801 2802 Power Analyzer User Guide Figure 67 Waveform Channel 1 Real time...
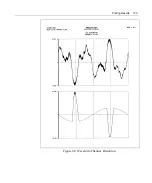
Page 103: ...Printing Results 103 Figure 68 Waveform Channe1 Distortion...
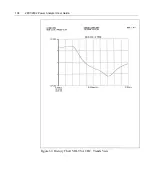
Page 104: ...104 2801 2802 Power Analyzer User Guide Figure 69 History Chart VOLTS ACDC Trends View...
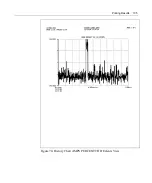
Page 105: ...Printing Results 105 Figure 70 History Chart AMPS PERCENT THD Extents View...
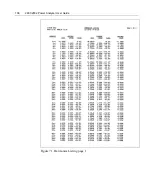
Page 106: ...106 2801 2802 Power Analyzer User Guide Figure 71 Harmonics Listing page 1...
Page 107: ...Printing Results 107 Figure 72 Harmonics Listing page 2...
Page 145: ...Sending Commands and Interrogatives 145...
Page 147: ...Appendix A Physical Specifications 147...

