background image


14 


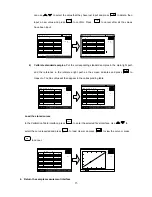
Press 

  to enter the setup interface. Two methods are then available. 


Set up standard curve: 

Method 1: Input regression equation 

1)  Set Fit Curve method. 

Press 

 to set Fit Curve method, use 

,

 to choose the 

method and press 

 to confirm. 

2) Set 

wavelength. 

Press 

 to set wavelength. Use 

,

 to choose measure method, 

then press 

  to confirm. Input the wavelength value required and press 

 to confirm. 

3)  Input the factor of the regression equation. 

Press 

  and input the factors, then press 

 to confirm. 


Method 2: Use standard samples   

1)  Set fit method.

 Press 

  to set fit method, press 

,

  to choose fit method, then press 

 to confirm. 

2) Set 

wavelength. 

Press 

 to enter the wavelength setting interface, press 

,

 to 

select measure method and press 

 to confirm. Input the value of the wavelength and 

press 

 to confirm. 

3)  Set up standard samples.

 Press 

 to set up standard, input the concentrations of 

corresponding standard samples according the indication and press 

 to confirm. users 

Summary of Contents for UV-6300PC

Page 1: ...UV 6300PC Spectrophotometer Instruction Manual European Catalogue Number 634 6041 Version 1 0 2 Issued 04 April 2014 ...

Page 2: ...Legal Address of Manufacturer Europe VWR International Europe bvba Researchpark Haasrode 2020 Geldenaaksebaan 464 B 3001 Leuven Tel 32 16 385 011 http www be vwr com Made in China ...

Page 3: ...tion of Buttons and Switches 6 Operational Keys 7 Getting Started 9 Important Guidelines 10 General Operating Instructions 10 Operation 11 Basic Mode 12 Quantitative Mode 13 Wavelength Scan 17 Kinetics 19 DNA Protein Mode 22 Multi Wavelength Mode 23 System Utility 25 Troubleshooting 29 Repair and Maintenance 30 Daily maintenance 30 Check lamp 31 Spare Parts Replacement 31 ...

Page 4: ...8 System check and calibration function 38 Installation 39 Introduction 42 Operation 46 Single wavelength photometric measurement 46 Fixed point measurement 47 Wavelength Scanning 52 Time Scanning Kinetic Analysis 64 DNA Protein Measurement 66 Appendix 1 69 Technical service 70 Warranty 70 Equipment disposal 71 ...

Page 5: ...ice is a high voltage area Do not use the device if it is damaged especially if the main power cable is in any way damaged or defective Repairs may only be carried out by the service technicians from your local VWR office and authorized contractual partners The device must be connected to a power outlet that has a protective ground connection If the equipment is used in a manner not specified by t...

Page 6: ...st the packing list If any of the items are missing or damaged please contact your local VWR office and authorized contractual partners Installation Placement Place the instrument carefully on a stable surface Install printer optional Check to confirm instrument power switch is turned off connect the printer s data cable to the instrument s parallel port Link the power cord Check to confirm the in...

Page 7: ...ength Accuracy 0 3 nm Photometric Accuracy 0 3 T or 0 002 A 1A Baseline 0 001 A 200 to 1000 nm Stability 0 001 A h 500 nm Memory 32K internal Unlimited USB disk Language English French German Spanish Display 320 240 Dots Matrix LCD Interface USB Parallel Measuring Procedure Photometry Quantitation Wavelength Scan Kinetics DNA Protein Multi wavelength Power Supply AC 110 220 V 50 60 Hz Dimension 59...

Page 8: ...eter used in chemistry pharmaceuticals biochemical metallurgy light industry textile material environments medical education and some other fields for quality control laboratories Description of Buttons and Switches Front View Rear View ...

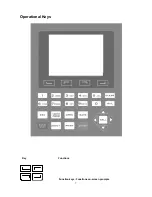
Page 9: ...7 Operational Keys Key Functions Function keys Functions on screen prompts ...

Page 10: ...k OPEN key Open files stored in internal memory SAVE key Save files to internal memory START STOP key Start Stop testing GOTO ʎ key Set wavelength PRINT key Print measuring result ENTER key Confirm operation CELL key Select Deselect auto cell holder RIGHT LEFT keys Search peak valley and set X scale UP DOWN keys Scroll menu data and set Y scale ...

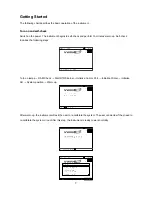
Page 11: ... 15 minutes warm up Self check includes the following steps Turn on lamps RAM Check Start RTOS kernel Initialize Comm Port Initialize Printer Initialize AD System position Warm up After warm up the instrument will ask the user to re calibrate the system The user can decide if they need to re calibrate the system or not After this step the instrument is ready to work normally ...

Page 12: ...ting Instructions Select application Main menu press numeric keys or use the keys to select the corresponding menu then press to enter Set wavelength Press to set wavelength use numeric keys to input the values press to confirm and go to the point you set then carry out the blank automatically Set parameters In different application press function key to set parameters press to choose or input the...

Page 13: ...name using the numeric keys and press to save If the USB disk was installed the data will save in the USB disk otherwise the data will save in the internal memory Load the stored file In the test interface press to go into the file selecting interface press to select the file you want press to open If the USB disk was installed the data will open from the USB disk otherwise the data will open from...

Page 14: ... 3 Set concentration unit Press to set concentration unit Press to choose unit then press to confirm You can also choose Other to input the self defined unit 4 Set Factor or Standard There are two possible methods Method 1 Input Factor F Press to set F Input the value of F using the numeric keypad press to confirm The F value will then be displayed on the screen Method 2 Standards Mark Put the ref...

Page 15: ...nce in the reference light path the result is then displayed on the screen automatically 7 Print the test results Press to print the test results Quantitative Mode 1 Enter into Quantitative Mode Main menu press or press to select Quantitative Mode then press to confirm 2 Set unit Press to set concentration unit press to select and press to confirm 3 Set up standard curve or load the stored curves ...

Page 16: ...s to confirm 3 Input the factor of the regression equation Press and input the factors then press to confirm Method 2 Use standard samples 1 Set fit method Press to set fit method press to choose fit method then press to confirm 2 Set wavelength Press to enter the wavelength setting interface press to select measure method and press to confirm Input the value of the wavelength and press to confirm...

Page 17: ...ard samples in the main light path and the reference in the reference light path as the screen indicates and press to measure The Abs value will then appear in the corresponding table Load the stored curves In the Calibration Table interface press to enter the selected file s interface Use to select the curve required and press to load Users can press to view the curve or press to cancel 4 Return ...

Page 18: ...e samples Place the sample to be tested in the main light path and reference in the reference light path then press to measure The test result will then be displayed in the data sheet Repeat this step until all the samples have been measured 6 Print the test results Press to print the test results ...

Page 19: ...enter 2 Parameters setup Press to set parameters set scan from scan to scan step and scan speed then press to confirm 3 Set photometric mode Press to set photometric mode choose T Abs or E and press to confirm 4 Scan samples Put the sample to be measured in the main light path and put reference in the reference light path press ...

Page 20: ...set peak height input the peak height and press to confirm Press to display the value of every wavelength point Press to display the value of every peak 6 Smooth the curve After scanning if there are many burrs visible press to smooth the curve 7 Print the test results After scanning press to print the test results ...

Page 21: ...19 Kinetics 1 Enter Kinetics Mode Main menu press or to select Kinetics Mode and press to confirm 2 Setup parameters ...

Page 22: ...of the wavelength using the numeric keypad and press to confirm 5 Measure samples Put the sample to be measured in the main light path and put reference in the reference light path press to begin the test or press to cancel 6 Calculate response rate After scanning users can calculate the response rate of a particular period by pressing to go into Process interface Input the values for Begin Time E...

Page 23: ...21 7 Search peaks After scanning has finished press to go into search mode Press to search the value of every point 8 Print the test results Press to print the test results ...

Page 24: ... measure method Press to set method Press to choose Absorbance Difference 1 or Absorbance Difference 2 then press to confirm If you do not want to measure reference use to select No then press to confirm 4 Set concentration unit Press to set concentration unit Use to select unit and press to confirm 5 Measure samples Put the sample to be measured in the main light path and put reference in the ref...

Page 25: ... test results Press to print the test results Multi Wavelength Mode 1 Enter Multi Wavelength Mode Main menu press or to select Multi Wavelength Mode and then press to enter the multi wavelength measurement interface ...

Page 26: ...or press to return 3 Set photometric mode Press to set the photometric mode use to select Abs or T mode press to confirm 4 Measure samples Put the sample to be measured in the main light path and put reference in the reference light path press to measure the test result will be displayed in the data table 5 Print the test results Press to print the test results ...

Page 27: ...6 VWR International bvba System Utility Main menu press or use to select System Utility and press to confirm Wavelength Reset Press or use to select Wavelength Reset then press to begin the calibration Note During the course of the calibration procedure opening the lid of the compartment is prohibited Printer Setup Press or to select Printer Setup then press to confirm ...

Page 28: ...e Select Printer and press to confirm Use to select the printer you wish to print from and then press to confirm Change Print Mode Press or use to select Change Print Mode and press to confirm Two modes are available Print Data Sheet and Print the Display Interface Lamp Service Press or use to select Lamp Service press to enter the Lamps Management interface Switch On Off D2 lamp Press or to selec...

Page 29: ...ff the W lamp Reset the W lamp usage time Press or use to choose Reset W lamp usage time and press The W lamp s usage time will then be displayed and the system will ask for confirmation that you want to reset the usage time Press to select Yes and then press to confirm The system will record the usage time from zero Change switch point Press or use to choose Change Switch Point and press to confi...

Page 30: ...me and press to confirm Then the time will then be displayed in the top right corner Display date Press or use to select Display Date and press to confirm The date will then be displayed in the top right corner Refresh dark current Press or use to select Refresh Dark Current and press to confirm The system will then begin to refresh the dark current Note During this process opening the lid of the ...

Page 31: ... opening the lid of the compartment is prohibited Delete all saved files Use to select Delete All Saved Files and press to confirm The system will ask for confirmation that you want to delete all files Use to select Yes then all the files in the RAM will be deleted Restore default settings Use to select Restore Default Settings and press to confirm The system will then restore the initial settings...

Page 32: ...e Cuvettes were contaminated Clean cuvettes Samples were contaminated Improve samples Poor matching of the cuvettes Improve the matching of the cuvettes Dark current error Resample dark current Repair and Maintenance Daily maintenance Check the compartment After measurement the cuvettes with sample solutions should be taken out of the compartment in good time otherwise the volatilization of the so...

Page 33: ...ck the energy You will need to replace the W lamp in the following two cases Energy 20 from 500 to 340 nm W lamp is damaged Energy 5000 at 500 nm W lamp energy is too low You will need to replace the D2 lamp in the following two cases Energy 20 from 339 to 200 nm D2 lamp is damaged Energy 1000 at 500 nm D2 lamp energy is too low Spare Parts Replacement Replace the fuse Danger Be sure to switch off...

Page 34: ...lamp chamber after power off to avoid scalding 1 Tools preparation Prepare a 6 150 mm cross blade screwdriver and a pair of gloves 2 Power off Switch off the power supply and unplug the cord from the socket 3 Open the cover Unscrew the 4 screws indicated 2 screws on each side and remove the cover 4 Open the cover of the light chamber Unscrew the 2 screws on the light chamber cover and remove it ...

Page 35: ...ector again 6 Replace W lamp The tungsten lamp is equipped with a blue grey silicon coating by manufacturer This coating is only a transport safety device It can be removed with the first change of lamp bulb Pull out the defective W lamp using a cotton glove Insert the new W lamp as deep as possible on the lamp seat Be sure to keep the filament in the same direction as the previous one faced 7 Adj...

Page 36: ... up or down until the facular is flush with the centre of the slot Then fix the No 2 screws again 8 Finish Reset the cover of the light chamber and fix the screws Reset the cover of the instrument and fix the screws Finally recover the pole in the compartment Replace the battery Be sure to switch off the power supply and unplug the cord from the socket before opening the bottom cover 1 Prepare the...

Page 37: ...634 6057 CELL HOLDER 4 CELL 10 TO 50 MM 1PC 634 6045 CELL HOLDER 4 CELL 10 TO 100 MM 1PC 634 6046 CELL HOLDER 1 CELL 100 MM 1PC 634 6047 CELL HOLDER FOR CYLINDRICAL CELL 1PC 634 6048 CELL HOLDER WATER JACKETED 1 CELL 10 MM 1PC 634 6049 CELL HOLDER WATER JACKED 4 CELL 10 MM 1PC 634 6050 CELL HOLDER FOR TEST TUBES 1PC 634 6051 CELL HOLDER SOLID SAMPLE 1PC 634 6052 CELL HOLDER FOR MICRO CELLS BEAM HE...

Page 38: ... FLOW CELL 5 MM GLASS BEAM HEIGHT 15 MM 1PC 634 0690 FLOW CELL 10 MM GLASS BEAM HEIGHT 15 MM 1PC 634 0691 FLOW CELL 20 MM GLASS BEAM HEIGHT 15 MM 1PC 634 0692 FLOW CELL 30 MM GLASS BEAM HEIGHT 15 MM 1PC 634 0693 FLOW CELL 5 MM QUARTZ BEAM HEIGHT 15 MM 1PC 634 0694 FLOW CELL 10 MM QUARTZ BEAM HEIGHT 15 MM 1PC 634 0695 FLOW CELL 20 MM QUARTZ BEAM HEIGHT 15 MM 1PC 634 0696 FLOW CELL 30 MM QUARTZ BEAM...

Page 39: ...factor values to generate regression curve 3 methods for curve fit Linear fit quadratic fit and cubic fit Wavelength scanning Allows user to set scan step 0 1 0 2 0 5 1 0 and 5 0 nm Spectrum display mode can be changed Wavelength Transmittance or Wavelength Absorbance Peaks and valleys will be automatically detected after scanning user can define the peak threshold Powerful spectrum processing fun...

Page 40: ...e not readily apparent in an absorbance spectrum Calculate spectrum You can calculate addition subtraction multiplication and division between two spectra with the resulting data displayed on the screen System check and calibration function Instrument validity check Up to 10 wavelength points can be set in the instrument validity mode Two methods can be selected Photometric Validity measurement an...

Page 41: ...ve hard disk space Microsoft Windows XP Vista 7 8 Install UV Vis Analyst 1 Put UV Vis Analyst disc in the CD ROM 2 Double click to open the CD ROM then double click Setup exe under the root directory of the CD to start installation Click Next 3 Choose install path then click Next to copy files to PC 4 After all files of UV Vis Analyst have been copied it will start to install the USB drive Click N...

Page 42: ...ck Next Cancel 5 Select I accept this agreement Click Next to copy files to PC Back Next Cancel 6 Click Finish to finish installation of the USB drive Back Finish Cancel 7 Click Finish to complete the setup ...

Page 43: ...pectrophotometer using the USB cable Spectrophotometer is on main interface There are two ways to start the UV Vis Analyst Double click shortcut icon on the desktop Start All Programs UV Vis Analyst UV Vis Analyst Set up communication port Start the UV Vis Analyst then on the UV Photometer menu click Comm Port Setup to bring up the following box select the Comm Port and Baud Rate 38400 and click O...

Page 44: ...tware offering you two ways to select a desired function On the menu bar use your keypad or mouse to select the desired function Almost all the functions listed in the menu bar can be reached by clicking a corresponding button in the toolbar Main Menu Sub Menu Tool Function File New New fixed points measurement New wavelength scan measurement New time scan measurement New DNA protein measurement ...

Page 45: ...ta or method Print Print test report Print Setup Set up printer Exit Exit UV Vis analyst View Status Bar Display hide status bar Status of Spectrophotometer Display status of spectrophotometer Status font Set up font of status bar Customize Define the information of display and print Peaks Mark peak value Valleys Mark valley value Magnify Magnify the area selected Restore Restore the default param...

Page 46: ...an system baseline Automatic Blank Calibration Carry out the blank Slit Bandwidth Set slit bandwidth 0 5 1 2 4 5 Set Unit Set unit Turn on off W lamp Turn on off W lamp Turn on off D2 lamp Turn on off D2 lamp D2 W Switch Point Set switch point of D2 W Comm Port Setup Set up comm port Change Password Set change login password Auto sample Locate Cell Locate cell 1 8 to light path Setup Multicell Set...

Page 47: ...raging Smooth a spectrum with the moving window averaging method Savitzky Golay Smoothing Filter Smooth a spectrum with the Savitzky Golay smoothing filter Derivate Derivative of a spectrum Resample Resample a spectrum Window New Window New measurement window as current Cascade Multi windows display in a cascade Tile Multi windows display in tiled form Arrange Icons Arrange all icons minimized Spl...

Page 48: ...ith Variable Slit Only for the model with 8 Cell Auto Charger Operation This chapter describes how to use UV Vis Analyst Single wavelength photometric measurement The UV Vis Analyst provides a convenient method to measure photometric value at a fixed wavelength 1 Click on the toolbar to display Goto specified wavelength 2 Enter the desired wavelength position click Goto The minimum wavelength step...

Page 49: ...velength photometric measurement 1 Click on the toolbar to display the following form 2 Click the Method tab 3 Enter the number of wavelength points in the Number of WL Points box or click the up down arrows next to the box set the wavelength points Leave the two boxes Calculate Concentration and Use Standard Samples 4 Enter the wavelength in the Wavelength box 5 Place a reference in the reference...

Page 50: ...nt Click Start or to run a new measurement The display will change to the following Enter the sample name in the Name box 8 Click OK The photometric data for sample will be listed in the Sample table 9 Repeat steps 7 and 8 to measure all samples ...

Page 51: ...ne between the first and third wavelengths is calculated and its value at the second wavelength is subtracted from the absorbance at the second wavelength to give the peak height 4 Enter the wavelengths in the Wavelength boxes 5 Tick the Calculate Concentration tick box to activate concentration calculation 6 Set up the linear regression curve Method 1 Set up the linear regression curve with prepa...

Page 52: ...e factor of the linear regression curve 1 Leave the Use Standard Samples tick box unticked 2 Click down arrow in Curve Fit box to select curve fit method 3 Input the factor of the linear regression curve 7 Click Fitting tab to view the linear regression curve Click Display Setting tab to set the display parameters and unit of concentration ...

Page 53: ...le tab 4 Place Sample 1 into the sample holder 5 Click Start to run a measurement 6 UV Vis Application software will display the photometric value of Sample 1 at the fixed wavelength positions automatically Enter the sample name in the Name box The default is Sample 1 7 Click OK The photometric result for Sample 1 will be listed in the sample data Delta Abs and concentration value of Sample 1 will...

Page 54: ... Click on the toolbar to new a sample scan measurement to display the following form 2 Click on the toolbar to display the following form Input start wavelength in From box range 190 1100 nm end wavelength in To box range 190 1100 nm select scan interval 0 1 0 2 0 5 1 0 2 0 or 5 0 nm and filter times 5 10 30 or 50 click OK ...

Page 55: ...r click to select Absorbance mode 4 Click on the toolbar to set display parameters 5 Place reference into the reference holder 6 Place sample into the sample holder Click to scan sample the real time spectrum will be displayed Click to cancel while scanning ...

Page 56: ...al scales Click on the toolbar to restore the default display settings Zoom selected area Click on the toolbar to activate zoom function Position the cursor in the upper left corner of the area you want to select Hold the left mouse button to drag the cursor to outline the spectrum area you want to enlarge Release the mouse button The part of the spectrum which is displayed within the outlined are...

Page 57: ...ir cursor appears move the cursor on the spectrum Move the crosshair cursor left or right on the spectrum The data in the cursor window indicate the X axis and Y axis values for the current cursor location Press ESC key to release the crosshair cursor ...

Page 58: ... in the drop down menu Click the spectrum you want to select Its name will be listed in the Name Box and it will be referred to as Current Spectrum Derivative Click on the toolbar The following dialogue box appears Enter the class of derivative 1 10 depending on whether first second tenth derivative is required and a name for the result spectrum then click OK The result spectrum will be displayed ...

Page 59: ...Click on the toolbar The following dialogue box will be displayed Click up down arrow of the Range box to select range value enter a file name in the Name box click OK The result spectrum will be displayed overlaid with the original one ...

Page 60: ...isplayed Click up down arrow to select the parameters enter a file name in the Name of Result box click OK The result spectrum will be displayed overlaid with the original one Resample Click on the toolbar The following dialogue box will be displayed Click Up Down arrow to select Sample times Click OK The new spectrum is displayed ...

Page 61: ...select a spectrum and define it as source 1 Select a spectrum for File 2 in the same way It will not allow you to select the same spectrum twice Enter a name for the Result spectrum and click OK The result spectrum will be displayed on the screen UV Vis Analyst will only add subtract multiply and divide two spectra that are already displayed on the screen Before arithmetic processing load or colle...

Page 62: ...lick on the toolbar The following dialogue box will be displayed Click the down arrow next to File 1 to select a spectrum and define it as source 1 Select a spectrum for File 2 in the same way It will not allow you to select the same spectrum twice Enter a name for the Result spectrum and click OK The result spectrum will be displayed on the screen ...

Page 63: ...ck on the toolbar The following dialogue box will be displayed Click the down arrow next to File 1 to select a spectrum and define it as source 1 Select a spectrum for File 2 in the same way It will not allow you to select the same spectrum twice Enter a name for the Result spectrum and click OK The result spectrum will be displayed on the screen ...

Page 64: ...k on the toolbar The following dialogue box will be displayed Click the down arrow next to File 1 to select a spectrum and define it as source 1 Select a spectrum for File 2 in the same way It will not allow you to select the same spectrum twice Enter a name for the Result spectrum and click OK The result spectrum will be displayed on the screen ...

Page 65: ...he display Define display information Click on the toolbar to display the Settings to display and print the spectra form click the Legend tab enter the information for display Edit print information Click on the toolbar to display the Settings to display and print the spectra form click the Print tab enter the information for printout ...

Page 66: ...will appear 2 Click on the toolbar to select the transmittance mode or click to select the absorbance mode 3 Click on the toolbar The following dialogue box will be displayed Key in the wavelength total time in seconds and scan step in the dialogue box The wavelength range should be within 190 to 1100 nm The upper limit for total time is 100000 s Seven scan intervals can be selected from 0 5S 1S 2...

Page 67: ...tart scanning automatically The graph will be displayed on the screen during time scanning You can stop scanning by clicking Calculate rate Click on the toolbar to display the Settings to display and print the spectra form click the Dynamic Analysis tab enter the start time in Time Begin box enter the end time in Time End box and enter the K factor in K Factor box click Calculate the result will b...

Page 68: ...mation for display Edit print information Click on the toolbar to display the Settings to display and print the spectra form click the Legend tab enter the information for display DNA Protein Measurement This chapter describes how to perform DNA Protein measurement DNA protein measurement 1 Click on the toolbar the following dialogue box will appear ...

Page 69: ...e value of DNA Protein Conc 3 Place a reference in the reference holder 4 Click the Sample tab It will display the following The control menu contains six buttons Start Delete Modify Recalculate Font and Print 5 Place a sample in the sample holder Click Start or to run a new measurement The display will change to the following ...

Page 70: ...c value of sample 1 at the fixed wavelength automatically Enter the sample name in the Name box Click OK after the measurement is complete The photometric data for sample 1 will be listed in the sample table 7 Repeat steps 5 and 6 to test all samples ...

Page 71: ...69 Appendix 1 Methods of Quantitative Analysis Single Wavelength Method Abs A1 Double Wavelengths Method Abs m A1 n A2 Three Wavelengths Method Abs A1 W1 W2 A2 A3 W2 W3 A3 ...

Page 72: ... by accident abuse misuse or misapplication or from ordinary wear and tear If the required maintenance and inspection services are not performed according to the manuals and any local regulations such warranty turns invalid except to the extent the defect of the product is not due to such non performance Items being returned must be insured by the customer against possible damage or loss This warr...

Page 73: ...ur responsibility to decontaminate the equipment in case of biological chemical and or radiological contamination so as to protect from health hazards the persons involved in the disposal and recycling of the equipment For more information about where you can drop off your waste of equipment please contact your local dealer from whom you originally purchased this equipment By doing so you will hel...

Page 74: ...rnational Ltd VWR International Northern Ireland Ltd Orion Business Campus Northwest Business Park Ballycoolin Dublin 15 Tel 01 88 22 222 Email sales ie vwr com Italy VWR International PBI S r l Via San Giusto 85 20153 Milano MI Tel 02 3320311 02 487791 Email info it vwr com The Netherlands VWR International B V Postbus 8198 1005 AD Amsterdam Tel 020 4808 400 Email info nl vwr com New Zealand VWR ...

Reviews: