55
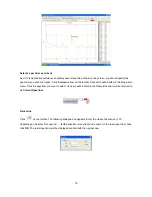
Trace a spectrum
Click
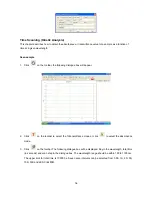
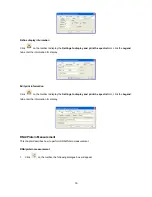
on the toolbar, a crosshair cursor appears, move the cursor on the spectrum. Move the crosshair
cursor left or right on the spectrum. The data in the cursor window indicate the X-axis and Y-axis values for
the current cursor location. Press ESC key to release the crosshair cursor.

