65
4. Place a reference in the reference holder.
5. Take out the blank in the sample holder, place a sample in it and close the cover.
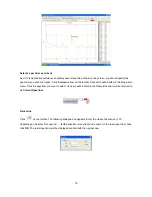
6. Place a sample in the sample holder. Click
on the toolbar. The instrument will start scanning
automatically. The graph will be displayed on the screen during time scanning. You can stop scanning by
clicking
.
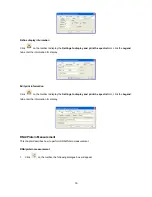
Calculate rate
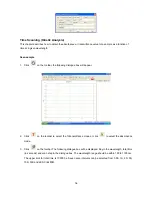
Click
on the toolbar to display the
Settings to display and print the spectra
form, click the
Dynamic
Analysis
tab, enter the start time in
Time Begin
box, enter the end time in
Time End
box, and enter the K
factor in
K Factor
box, click
Calculate
, the result will be displayed.


