Doc. P/N: WSP-009-005
Version: V1.5
Issue Date: October 2013
www.wassp.com
Page 69 of 73
Installation Manual
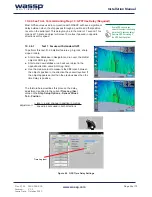
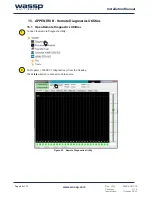
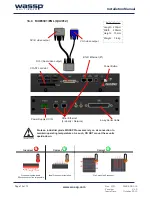
15.4 Bar Graph
The Bar Graph gives a visual
representation of the strength of
each channel of data received
by the multibeam system. This is
shown as magnitude, in YELLOW,
as well as I & Q data in RED and
GREEN. The slider on the right
hand side scales the display.
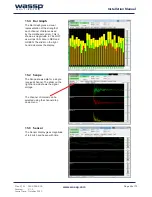
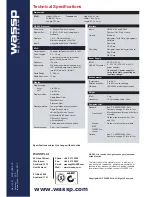
15.2 Scope
The Scope shows data for a single
received channel. The slider on the
right hand side shows the signal
voltage.
The channel of interest can be
selected using the channel drop
down menu.
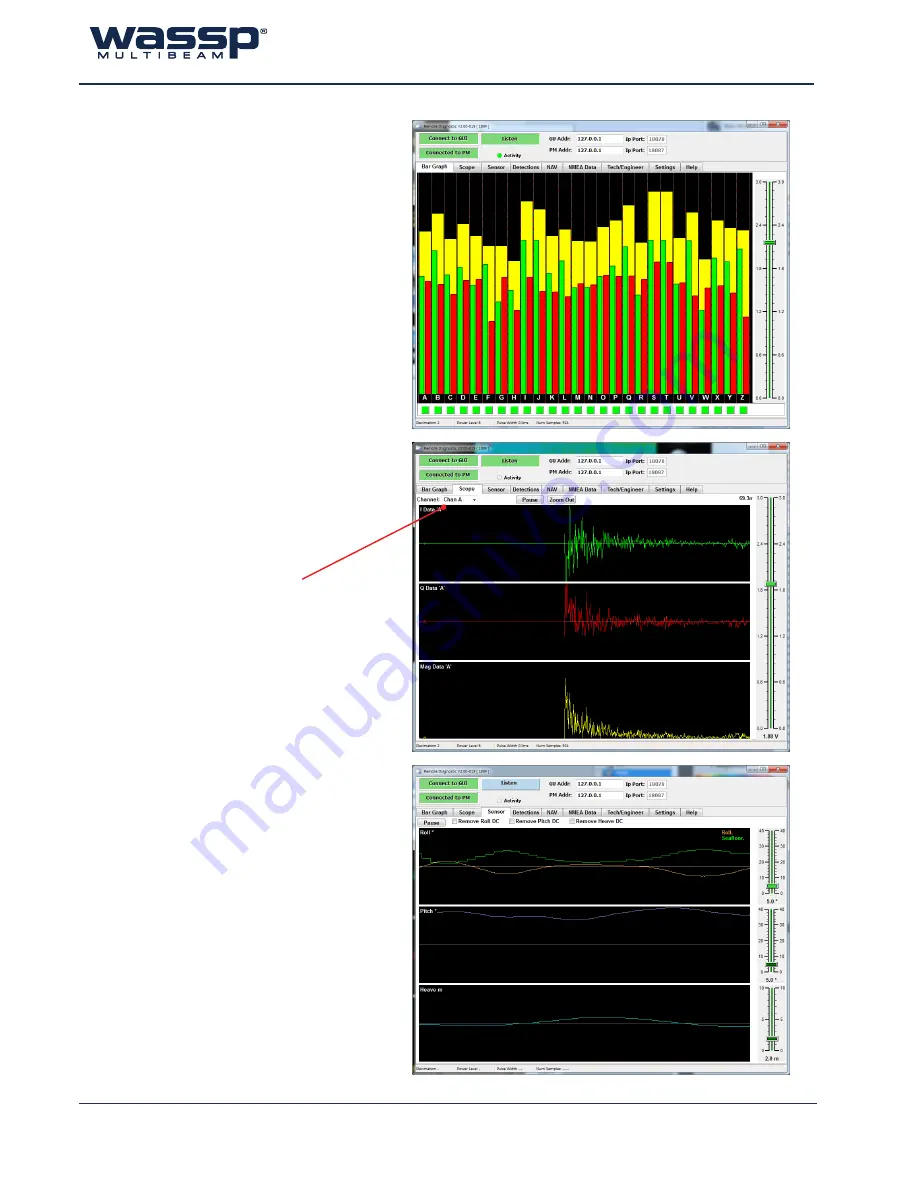
15.3 Sensor
The Sensor display gives magnitude
of roll, pitch and heave with time.