Watlow D4T Data Logger
•
38
•
Chapter 3 Using the D4T Front Panel
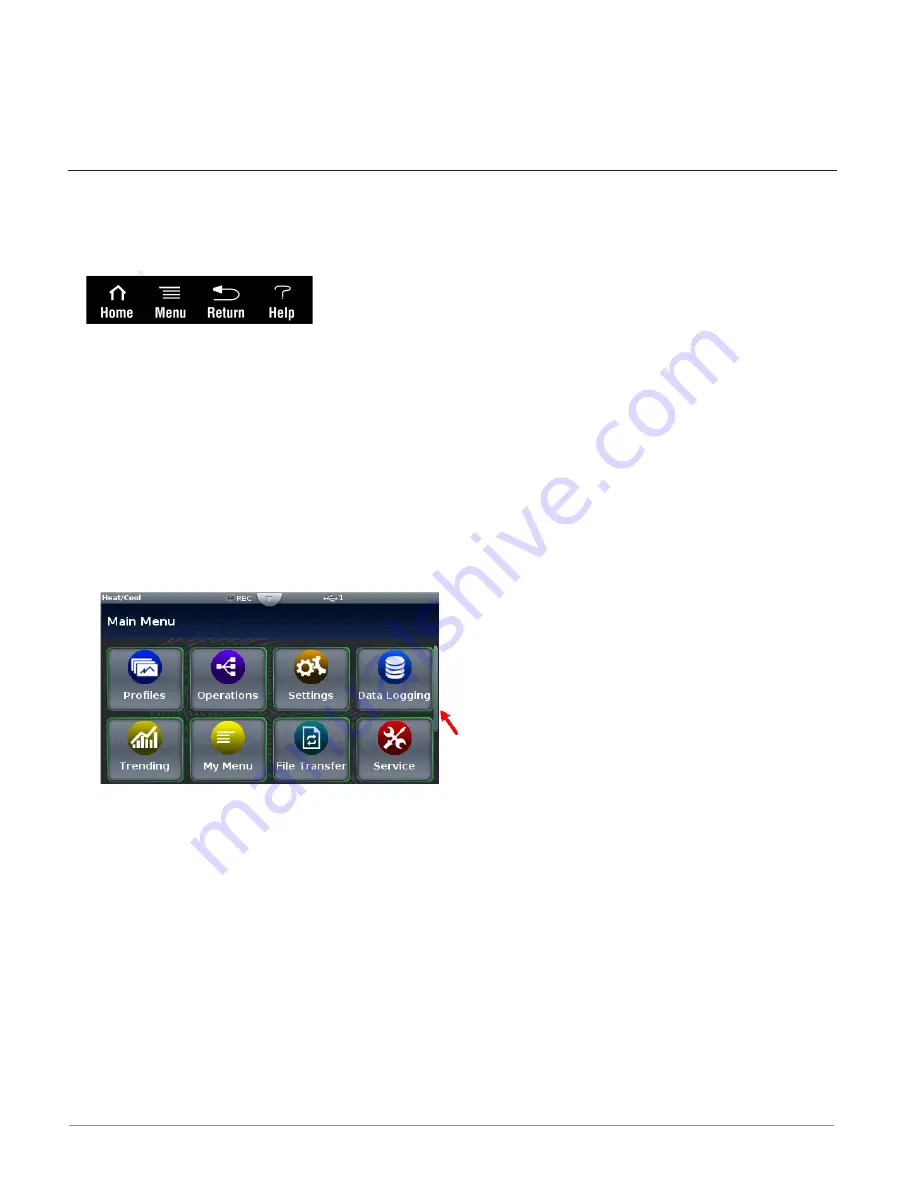
• Menu
: as shown below, will provide access to other settings and functions within the
data logger.
• Return
: when pushed, this button will take the user back to the previous screen until
the top level of either the home screen or the main menu are reached.
• Help
: displays information about the data logger such as: part number, software revi-
sion etc...
Note:
Depending on ordered options and configured features the Menu screen may have other
buttons that are not visible. The red arrow above shows a scroll bar that will appear when
this is the case. Swipe the screen upwards to view more.
3.
Next Page
: if the data logger has more than one page and the Home screen has been set-
up (Push
Menu button to Personalization) to display multiple pages, the left and right ar-
rows on each side of the home screen provides navigation from one to the other.
4.
Output Widget Bar
: user configurable events, function keys or output status (on/off). This
can be relocated on the screen (see:
).
Front Panel Navigational Buttons
When looking at the front panel of the D4T, at the bottom of the display, four push buttons
are displayed as icons shown below. The text in this graphic was placed there for clarity only
and is not present on the front panel.
• Home
: regardless of the screen currently in view, when pushed, will always return to
the Home screen which displays the following:
- Loop name: user designated (Chamber Temp, as shown above).
- Control mode: (Auto, as shown above).
- Process Value: input connected to the PV receiver of the loop function block.
- Set Point: which represents the desired value to be maintained by the data logger.
- PWR: output power levels for heat and cool if both are configured.
- Output Actions: allows a user to monitor the on/off status of user defined inputs or
outputs.


