PAZ
Plug-in Manual
6
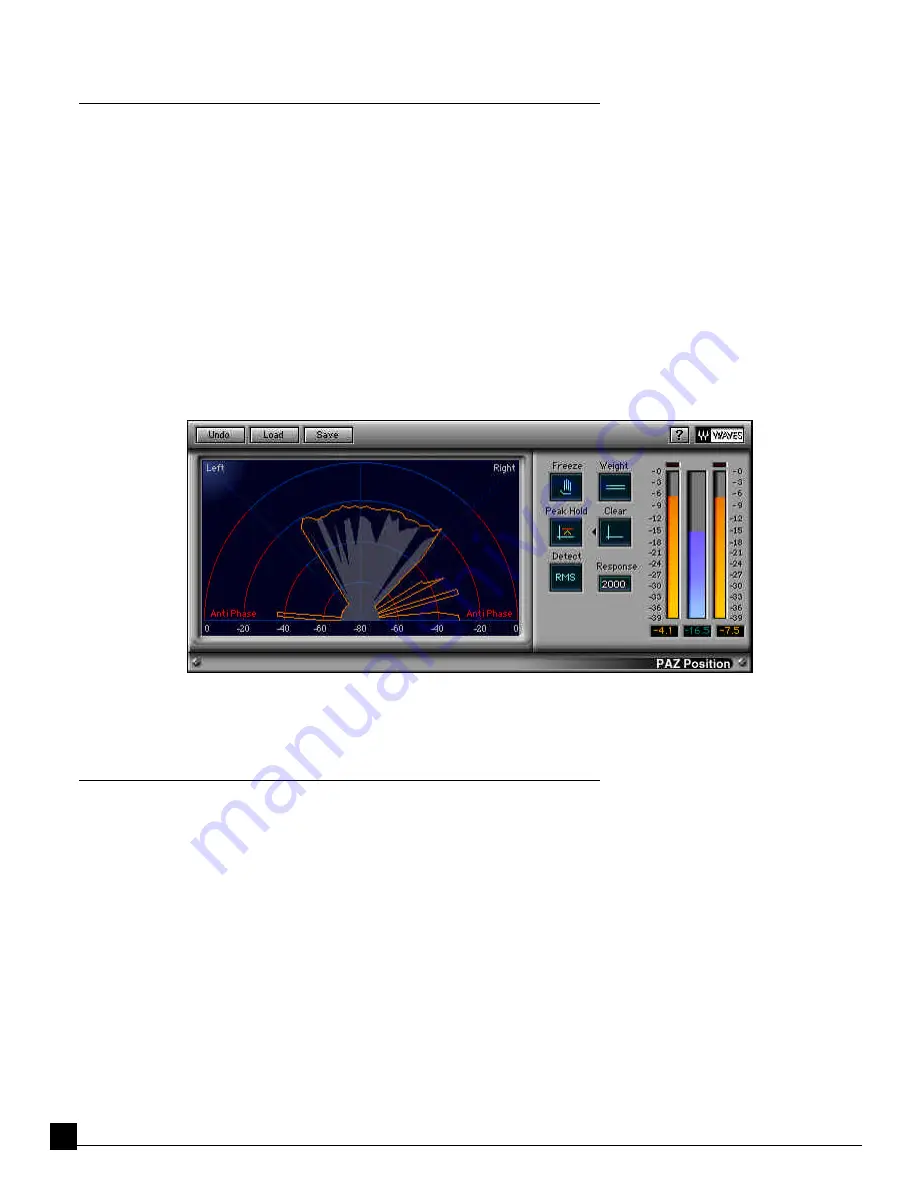
Stereo Position Display (SPD)
The SPD shows you the stereo energy in your mix, clearly and intuitively. This unique audio meter analyzes the
distribution of loudness across the stereo stage, as well as detecting out-of-phase components. It differs from the
common ‘phase display’ where left/right channels are displayed against each other on a oscilloscope screen.
For those familiar with the Waves S1 Stereo Imager, the Stereo Position Display will seem familiar, as both use a
polar coordinates graph. Loudness is shown by length of the line and stereo position is shown by the angle (direc-
tion). The concentric lines are 20dB step indications.
In other words, a mono signal goes straight up (as will anything in the center of a stereo mix). A hard left or right
sound will go 45 degrees to the respective sides. Most stereo mixes will have a fan-shaped display centered around
the vertical line with occasional little spikes shooting out at greater angles.
Out-of-phase signals are shown between 45 and 90 degrees on each side. In the area beyond 60 degrees on each side
have a red color in the background to indicate that signals in this range might be disturbing to the ears.
The controls
They are the same for the SPD as for the Frequency Display, except that when using the component Frequency plug-
in, only the related controls are shown.
About Anti-phase
It is a bit tricky to define when a signal is shown by the Stereo Position Display or heard by the ears as “out-of-phase”.
This is not simply when the left and right channels happen to have opposite polarity at any given instant. Such a
situation can happen if independent instruments are panned to different stereo positions, and it just happens,
statistically, that the signal of each channel has opposite polarities. The meter will show a quick spike in the anti-
phase area. This can also happen if a stereo delay or reverb is applied to an instrument and the delays arrive to each


