- -
- 18 -
6.9 VISUALIZATION UNBALANCING WHEEL MODE
It is possible to change the way that indicates the unbalance wheel value. There will be two
different display visualization modes.
3D visualization
: a 3D wheel is shown in the centre of the screen, where 2 painted dots are marked
inside and outside position rim, indicates the current position of the unbalancing values. Through
the dots colour modification will be indicate when the counterweight application point are
reached.
When this visualization is enable, this small dot normally is yellow colour and the unbalancing
indication is in white colour. When the correct position is approaching this value became in yellow
colour. When the position is correctly positioned the small dot became in red colour.
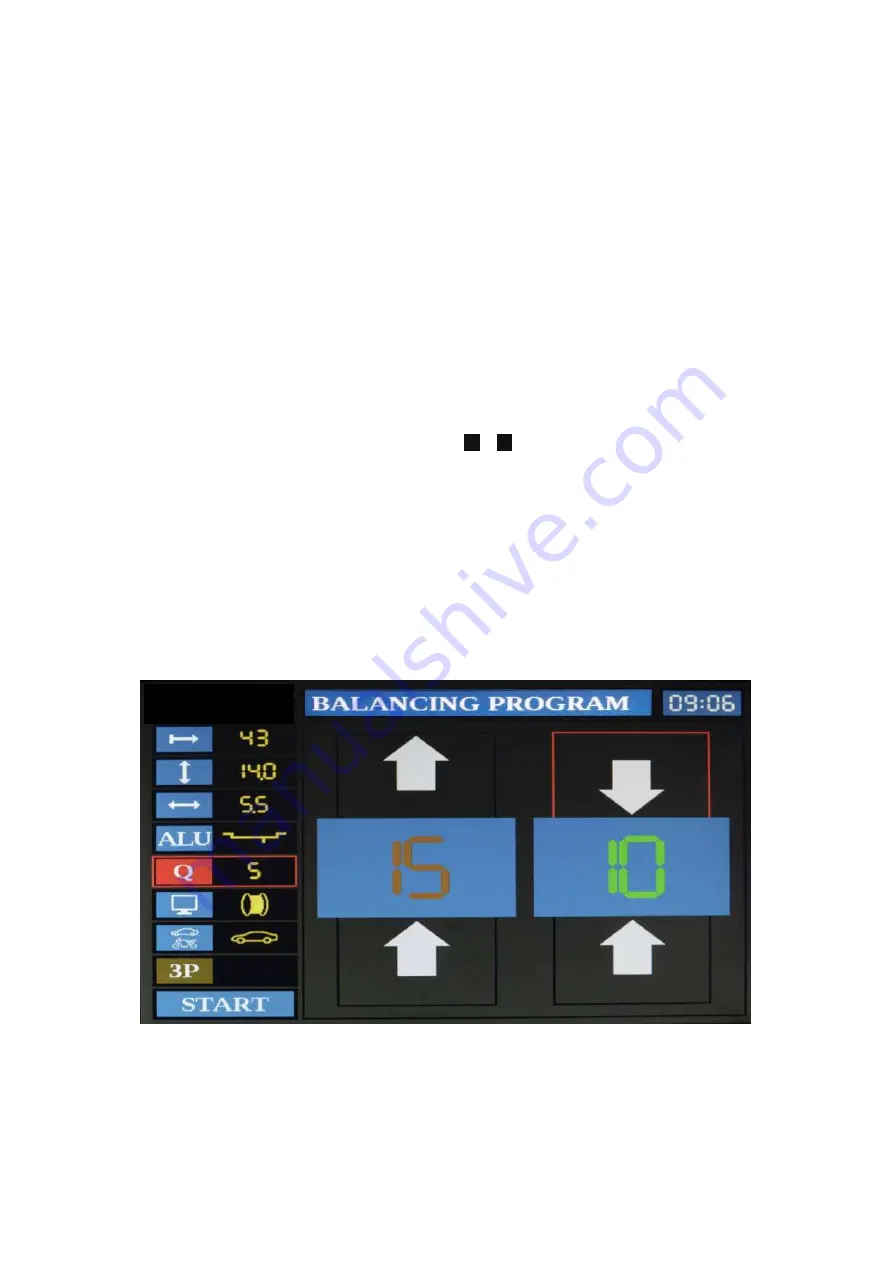
Simplified visualization
: only two numbers indicates the unbalancing values and two arrows on
each side , which shown where the counterweight application point are reached.
To choose which visualization has to be enabled, enter with arrows UP and DOWN till select
windows indicated with n.6 at Fig.7. Then press keys
+
e
-
. to modify parameters.
When this visualization is enable, the arrows indicate the sense of rotation of the wheel to reach the
right unbalance position. The colour of the value is in red colour when is so far from the right
position, and during the approaching correct position became gradually in green colour and the
two arrow indicate the value at the same time.
There will be also an indication regarding the position to apply the weight. When the highlight is on
the top square means that the weight has to be applied at 12 o’clock. When the highlight is on the
bottom square means that the weight has to be applied at 6 o’clock.
If the arrows are on opposite direction between them, means that the position in on the opposite
site
Fig. 10 – Balancing page – simplified visualization
LOGO


