H O W T O U S E T H I S E M S C U R V E
WILDEN PUMP & ENGINEERING, LLC
10
PX8 HS
Performance
EMS CURVE
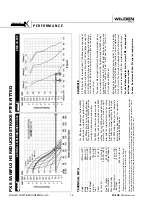
SETTING 4 PERFORMANCE CURVE
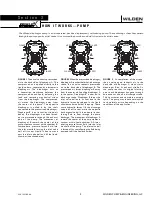
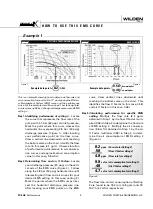
This is an example showing how to determine the inlet air
pressure and the EMS setting for your Pro-Flo X™ pump to
optimize the pump for a specifi c application. For this exam-
ple we will be using an application requirement of 18.9 lpm
(5 gpm) fl ow rate against 2.8 bar (40 psig) discharge pressure.
This example will illustrate how to calculate the air consump-
tion that could be expected at this operational point.
Step 1
: Establish inlet air pressure.
Higher air pres-
sures will typically allow the pump to run
more effi ciently, however, available plant air
pressure can vary greatly. If an operating
pressure of 6.9 bar (100 psig) is chosen when
plant air frequently dips to 6.2 bar (90 psig)
pump performance will vary. Choose an oper-
ating pressure that is within your compressed
air system's capabilities. For this example we
will choose 4.1 bar (60 psig).
Step 2
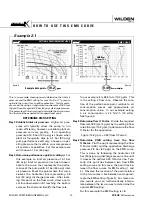
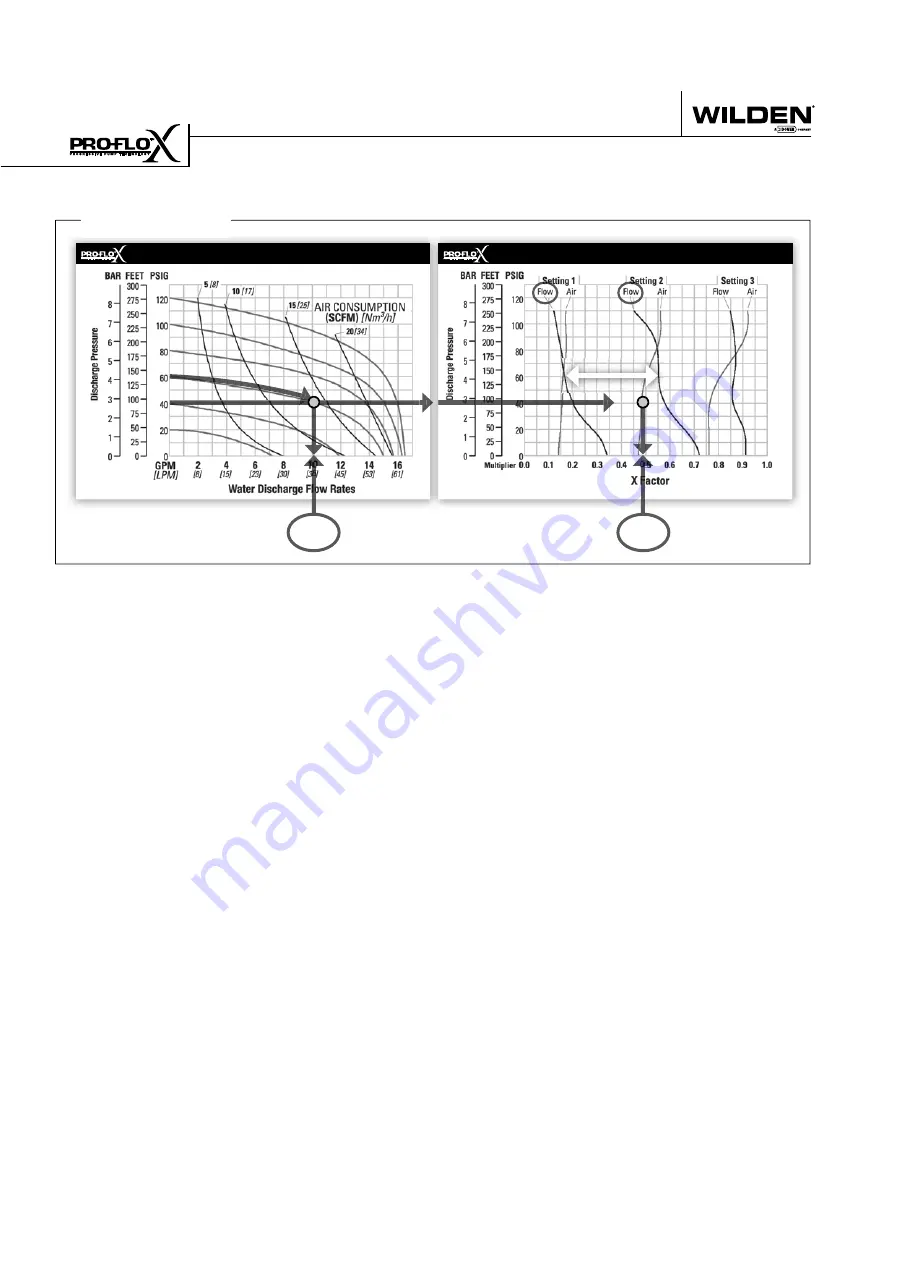
: Determine performance point at setting 4.
For
this example an inlet air pressure of 4.1 bar
(60 psig) inlet air pressure has been chosen.
Locate the curve that represents the perfor-
mance of the pump with 4.1 bar (60 psig) inlet
air pressure. Mark the point where this curve
crosses the horizontal line representing 2.8
bar (40 psig) discharge pressure. After locat-
ing this point on the fl ow curve, draw a verti-
cal line downward until reaching the bottom
scale on the chart and identify the fl ow rate.
In our example it is 38.6 lpm (10.2 gpm). This
is the setting 4 fl ow rate. Observe the loca-
tion of the performance point relative to air
consumption curves and approximate air
consumption value. In our example setting
4 air consumption is 24 Nm
3
/h (14 scfm).
See fi gure 4.
Step 3
: Determine flow X Factor.
Divide the required
fl ow rate 18.9 lpm (5 gpm) by the setting 4 fl ow
rate 38.6 lpm (10.2 gpm) to determine the fl ow
X Factor for the application.
Step 4
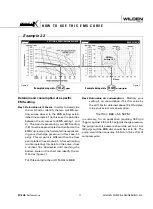
: Determine EMS setting from the flow
X Factor.
Plot the point representing the fl ow
X Factor (0.49) and the application discharge
pressure 2.8 bar (40 psig) on the EMS curve.
This is done by following the horizontal 2.8
bar (40 psig) psig discharge pressure line until
it crosses the vertical 0.49 X Factor line. Typi-
cally, this point lies between two fl ow EMS
setting curves (in this case, the point lies be-
tween the fl ow curves for EMS setting 1 and
2). Observe the location of the point relative
to the two curves it lies between and approxi-
mate the EMS setting (fi gure 5). For more pre-
cise results you can mathematically interpo-
late between the two curves to determine the
optimal EMS setting.
5 gpm / 10.2 gpm = 0.49 (flow X Factor)
DETERMINE EMS SETTING
For this example the EMS setting is 1.8.
Figure 4
Example data point =
10.2
gpm
fl ow multiplier
Figure 5
EMS Flow
Settings 1 & 2
Example 2.1
0.49
Summary of Contents for PX4 series
Page 9: ...PX8 P X 8 S A N I F L O H S P E R F O R M A N C E S A N I F L O...
Page 22: ...N O T E S...
Page 41: ......
Page 42: ...N O T E S WILDEN PUMP ENGINEERING LLC 40 WIL 12310 E 04...


