WiNRADiO G315 User’s Manual
67
Similarly to the
Spectrum Analyzer
and
Activity Monitor,
the Logger is
started, paused and stopped using three recorder-like buttons:
The log files can be also opened and saved using the same file open and save
buttons:
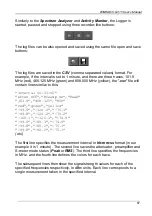
The log files are saved in the
CSV
(comma separated values) format. For
example, if the interval is set to 1 minute, and there are three traces, 101.9
MHz (red), 468.125 MHz (green) and 808.000 MHz (yellow), the "
.csv
" file will
contain lines similar to this:
"Interval 00:01:00"
"Atten Off","Preamp On","Peak"
"101.9","468.125","808"
"red","green","yellow"
"-99.9","-120.0","-75.1"
"-99.8","-120.2","-75.2"
"-100.1","-120.1","-74.9"
"-99.9","-80.1","-74.9"
"-99.8","-80.2","-75.1"
"-99.8","-80.2","-75.1"
(etc.)
The first line specifies the measurement interval in
hh:mm:ss
format (in our
example it is 1 minute). The second line saves the attenuator, preamplifier and
S-meter mode status (
Peak
or
RMS
). The third line specifies the frequencies
in MHz, and the fourth line defines the colors for each trace.
The subsequent lines then show the signal strength values for each of the
specified frequencies respectively, in dBm units. Each line corresponds to a
single measurement taken in the specified interval.

