Wireless Sensors, LLC
Ethernet Gateway Model GWAY-1100
Version 2.0 © July 2013
13 / 35
This feature captures all data currently displayed in the graph. The download method is browser
dependent; Clicking the download typically saves the date to a .csv file or displays it on a new
Web page that allows you to manually save the data as a .csv file.
Individual Sensor Selection
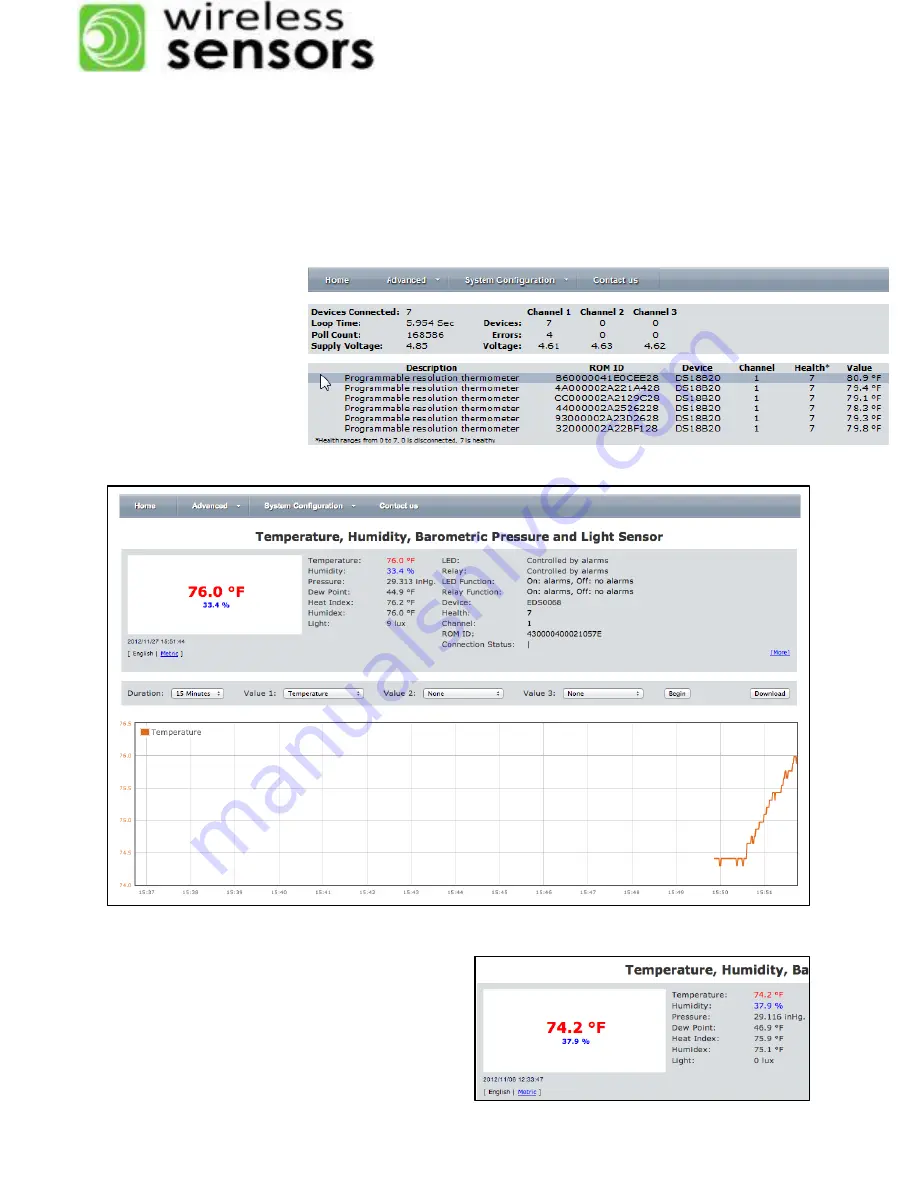
By highlighting and clicking on a sensor listed on the
Home
page, the user can access alarm
settings, modify limits and graph up to 3 different sensor values.
After an individual sensor
is selected a new screen
will appear that displays
variables associated with
the sensing device. Sen-
sors with many variables
will have some hidden, so
the
More
button may be
used to view the extended
list of variables.
Device Data
The top part of the screen displays information
about each connected device. Sliding the cursor
over and selecting a programmable value al-
lows users to assign a limit, change a function
or


