Technical Specifications/Logs
89
Greenstar 4000 – 6 720 891 162 (2020/09)
13.5
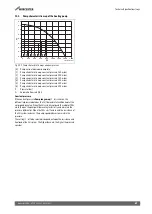
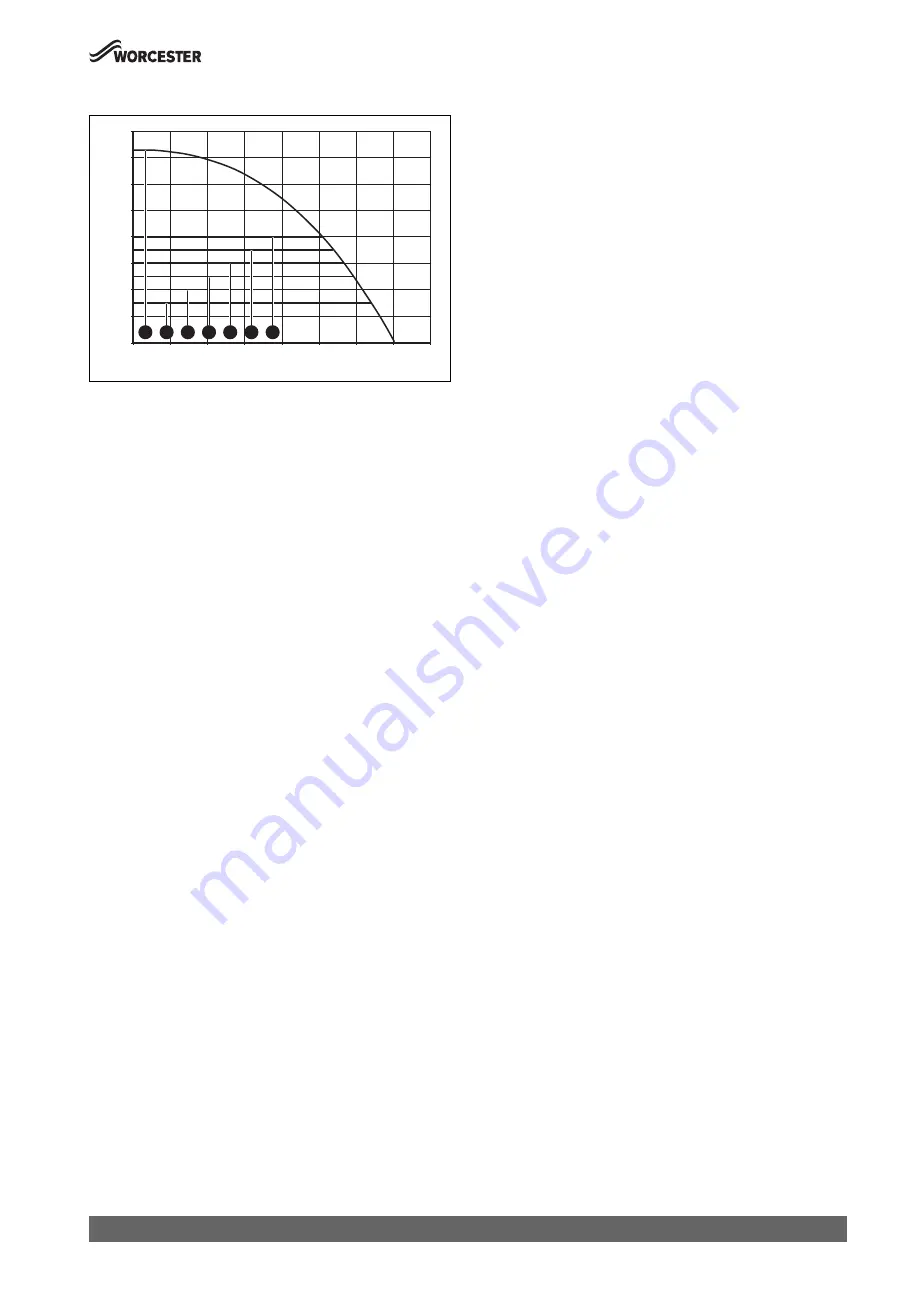
Pump characteristic map of the heating pump
Fig. 101 Pump characteristic maps and pump curves
[0]
Pump curve at maximum pump rate
[1]
Pump characteristic map, constant pressure 150 mbar
[2]
Pump characteristic map, constant pressure 200 mbar
[3]
Pump characteristic map, constant pressure 250 mbar
[4]
Pump characteristic map, constant pressure 300 mbar
[5]
Pump characteristic map, constant pressure 350 mbar
[6]
Pump characteristic map, constant pressure 400 mbar
P
Pressure (bar)
Q
Volumetric flow rate (l/hr)
Constant pressure
If the constant pressure
Pump range map
(1 - 6) is chosen, the
differential pressure between the CH flow and return will be kept at the
corresponding value. When the CH system is cold and the radiator TRVs
are fully open, the pump will be running faster to try and maintain the
pressure differential. When the TRVs start to close and the resistance of
the CH system increases, the pump speed reduces to maintain the
pressure.
The setting (1 - 6) to be selected is dependent upon the resistance and
heat load of the CH system. The higher these are, the higher the pressure
constant.
0010036045-001
Q
P
0.00
0.10
0.20
0.30
0.40
0.50
0.60
0.70
0.80
0
200
400
600
800
1,000
1,200
1,400
1,600
0 1 2 3 4 5 6

